Analyzing logs for a network with thousands of devices was a complicated, lengthy, and tedious job before I switched to the Elastic Stack as my centralized logging platform. It turned out to be a smart choice. Now, I have a single location to search all my logs, get near-instant search results, benefit from powerful visualizations for analysis and troubleshooting, and utilize dashboards that provide a helpful network overview.
The Elastic Stack is continuously evolving, introducing impressive features at a rapid pace with two new releases almost every month. I prioritize keeping my environment current to leverage these advancements and address any bugs or security vulnerabilities, which requires frequent updates.
Despite the Elastic website’s clear and detailed documentation, including guidance on product upgrades, manually upgrading, particularly the Elasticsearch cluster, is intricate. It involves numerous steps in a specific order. That’s why I chose to automate the process using Ansible Playbooks.
This Ansible tutorial will guide you through the Ansible Playbooks I created to automate upgrading my Elastic Stack installation.
Understanding the Elastic Stack
Previously known as the ELK stack, the Elastic Stack, comprising Elasticsearch, Logstash, and Kibana from Elastic, delivers a robust platform for indexing, searching, and analyzing data. Its applications are wide-ranging, spanning logging, security analysis, application performance monitoring, and site search.
Elasticsearch, the heart of the stack, is a distributed search and analytics engine enabling near real-time search results even with massive data volumes.
Logstash functions as a processing pipeline, ingesting data from diverse sources (currently 50 official input plugins), parsing, filtering, transforming, and transmitting it to various outputs, including the crucial Elasticsearch output plugin.
Kibana acts as the user and operations interface, facilitating data visualization, search, navigation, and the creation of insightful dashboards.
Introducing Ansible
Ansible, an IT automation platform, streamlines system configuration, software deployment and upgrades, and complex IT task orchestration. Its simplicity and ease of use are key strengths. One standout feature is its agentless nature, eliminating the need for additional software installation and management on managed hosts and devices. We’ll leverage Ansible’s automation capabilities to upgrade our Elastic Stack.
Disclaimer and a Note of Caution
The playbooks shared here are based on the official product documentation and intended for upgrades within the same major version, such as 5.x → 5.y or 6.x → 6.y where x>y. Cross-major version upgrades often require additional steps not covered in these playbooks.
Always review the release notes, particularly the breaking changes section, before using these playbooks for upgrades. Fully understand the tasks within the playbooks and cross-reference the upgrade instructions to ensure no crucial changes are missed.
It’s worth noting that I’ve employed these playbooks (or earlier versions) since Elasticsearch version 2.2 without encountering issues. Initially, I had separate playbooks for each product due to differing version numbers.
That said, I assume no responsibility for any consequences arising from using the information presented in this article.
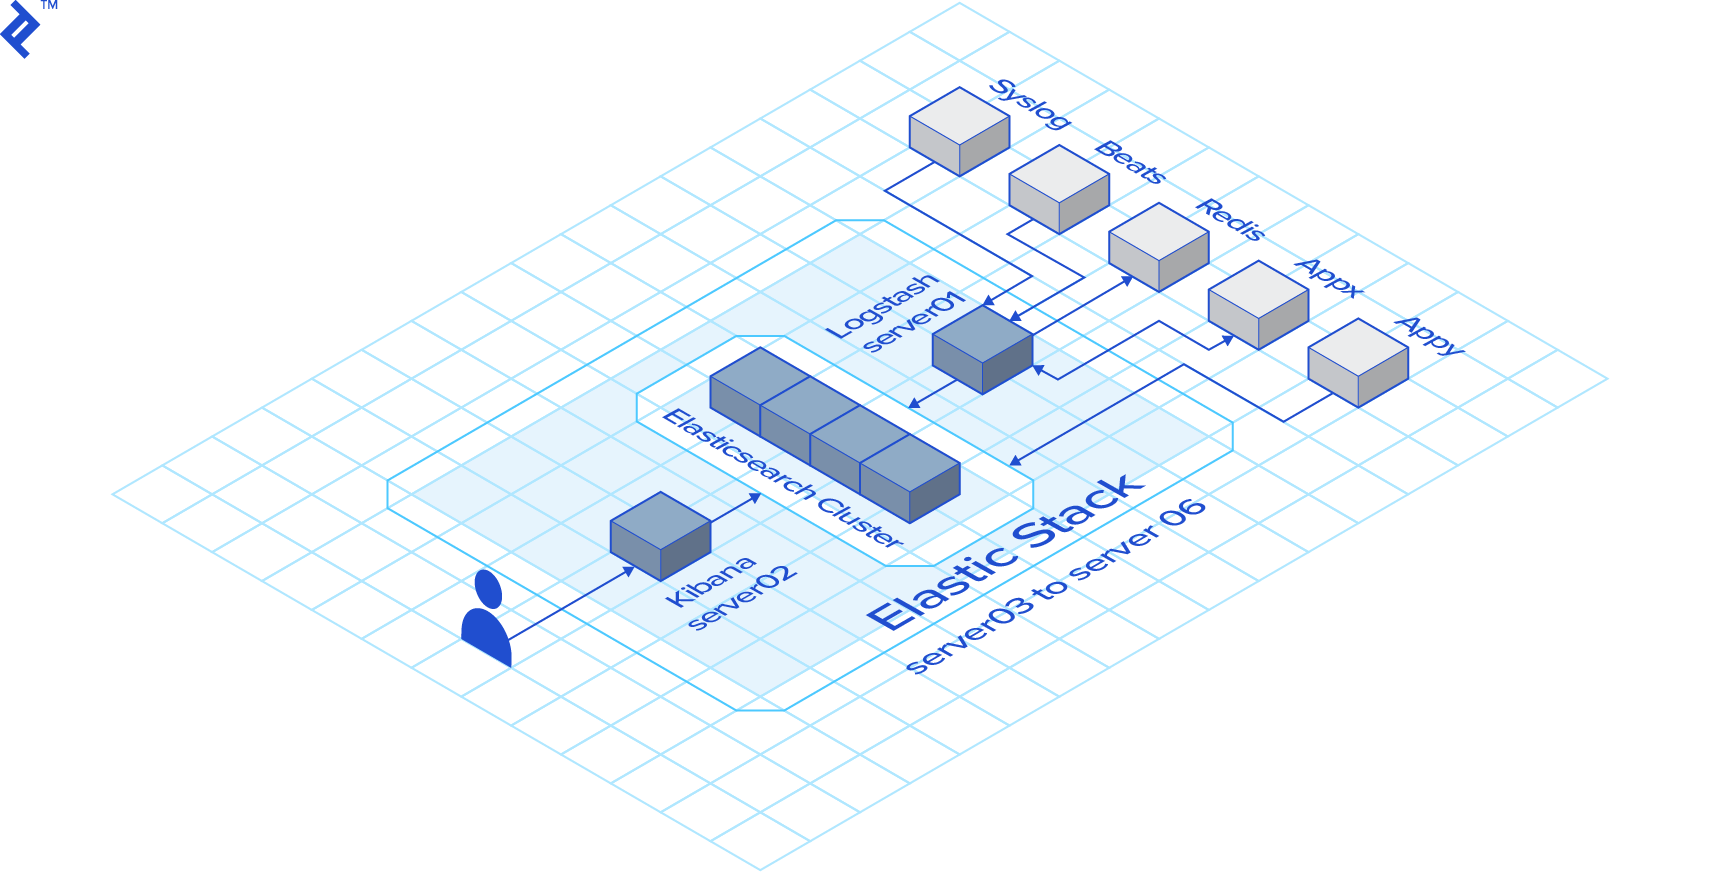
Our Hypothetical Environment
Our playbooks will operate within a simulated environment consisting of six CentOS 7 servers:
- 1 x Logstash Server
- 1 x Kibana Server
- 4 x Elasticsearch nodes
The number of servers in your environment is inconsequential. Simply reflect the actual count in your inventory file, and the playbooks should execute smoothly. If you’re not using an RHEL-based distribution, adapt the few distribution-specific tasks (primarily package manager related) accordingly.
The Inventory
Ansible relies on an inventory file to identify the target hosts for playbook execution. In our hypothetical setup, we’ll use the following inventory file:
| |
In this Ansible inventory file, sections enclosed in [] represent host groups. Our inventory includes three host groups: logstash, kibana, and elasticsearch. The playbooks utilize these group names, making the number of hosts in each group irrelevant as long as the group definitions are accurate.
The Upgrade Procedure
The upgrade process will adhere to these steps:
Pre-download the packages
Logstash Upgrade
Rolling Upgrade of the Elasticsearch cluster
Kibana Upgrade
The primary objective is to minimize downtime. Users should ideally experience no interruptions, though Kibana might be briefly unavailable, which is generally acceptable.
Main Ansible Playbook
The upgrade process is orchestrated through a series of playbooks. I’ll utilize Ansible’s import_playbook feature to consolidate all playbooks into a single main playbook for streamlined execution.
| |
This straightforward approach ensures the playbooks are executed in the correct sequence.
To illustrate the usage of this Ansible playbook, consider the following command, which upgrades the Elastic Stack to version 6.5.4:
| |
Pre-downloading the Packages
This initial step, while optional, is a recommended practice. It involves stopping a service before upgrading. While a fast internet connection minimizes package download time, it’s not always guaranteed. To minimize service downtime, the first playbook utilizes yum to download all packages beforehand.
| |
The first line restricts this play to hosts within the logstash group, while the second line disables fact gathering, enhancing speed as long as no tasks depend on host facts.
The first task verifies the elk_version variable, representing the target Elastic Stack version passed during playbook invocation. An invalid variable format will halt the play. This validation is present in all plays for potential isolated execution.
The second task retrieves the current Logstash version using the rpm command and stores it in the version_found variable for subsequent use. The lines args:, warn: no, and changed_when: False primarily satisfy ansible-lint requirements but aren’t strictly necessary.
The final task executes the package pre-download command only if the installed Logstash version is older than the target, avoiding redundant downloads.
The other two plays are nearly identical, pre-downloading Elasticsearch and Kibana instead of Logstash:
| |
Upgrading Logstash
Logstash should be upgraded first due to its backward compatibility with older Elasticsearch versions.
The initial tasks in this play mirror those in the pre-download play:
| |
The final two tasks reside within a block:
| |
The when conditional ensures these tasks execute only if the target version surpasses the current version. The first task within the block handles the Logstash upgrade, while the second restarts the service.
Performing a Rolling Upgrade of the Elasticsearch Cluster
To prevent Elasticsearch cluster downtime, we’ll perform a rolling upgrade, upgrading one node at a time after verifying the cluster’s health (green state).
The start of this play introduces a new element:
| |
While Ansible typically executes plays against multiple hosts concurrently, the serial: 1 line enforces sequential execution, one host at a time.
Next, we define variables for use within the play:
| |
The purpose of each variable will become apparent as they are used.
As always, the first task validates the target version:
| |
Many subsequent tasks involve REST calls to the Elasticsearch cluster, which can target any node. While the current host seems logical, some commands execute while its Elasticsearch service is down. Therefore, we’ll dynamically choose a different host for REST calls using the set_fact module and Ansible inventory’s groups variable.
| |
Before proceeding, we ensure the current node’s service is running:
| |
Similar to previous plays, we check the current version, opting for the Elasticsearch REST API instead of rpm to showcase an alternative.
| |
The remaining tasks are enclosed in a block that executes only if the current version is outdated:
| |
Contrary to the documentation, this step enables shard allocation. This is intentional to counteract any prior shard allocation disablement and prevent the next task (waiting for a green cluster state) from hanging indefinitely.
With shard allocation confirmed, we wait for the cluster to achieve a green state:
| |
The cluster might take a while to regain its green state after a node service restart. The retries: 500 and delay: 15 settings translate to a wait time of 125 minutes (500 x 15 seconds), generally sufficient but adjustable based on data volume.
Next, we disable shard allocation:
| |
Before stopping the service, we perform the optional yet recommended sync flush. Ignore any harmless 409 errors, as they are added to the success status codes.
| |
The node is now ready for the upgrade:
| |
While the service is stopped, we wait for all shards to be allocated:
| |
Once shard reallocation is complete, the Elasticsearch service is restarted, and we wait for it to become fully operational:
| |
Before reenabling shard allocation, we ensure the cluster is either yellow or green:
| |
Finally, we wait for the node to fully recover before moving on to the next one:
| |
As emphasized, this entire block executes only during actual version upgrades:
| |
Upgrading Kibana
Kibana is the final component to be upgraded.
As expected, the first tasks resemble those in the Logstash upgrade and pre-download plays, with the addition of a variable definition:
| |
The set_default_index variable will be explained later.
The remaining tasks, executed only if the installed Kibana version is outdated, reside within a block. The first two tasks handle the Kibana update and restart:
| |
Ideally, this should suffice for Kibana. However, upgrades sometimes result in Kibana losing its default index pattern reference, prompting the first post-upgrade user to define it, leading to potential confusion. To prevent this, a task resets the default index pattern, which is syslog in this example but should be adjusted to match your setup. Before setting the index, we ensure Kibana is up and ready:
| |
Conclusion
The Elastic Stack is an invaluable tool worthy of exploration. Its continuous improvement can be challenging to keep up with. I hope these Ansible Playbooks prove as beneficial to you as they are to me.
They are available on GitHub at https://github.com/orgito/elk-upgrade. I recommend thorough testing in a non-production environment before deployment.
If you happen to be a Ruby on Rails developer interested in integrating Elasticsearch into your application, I suggest checking out Elasticsearch for Ruby on Rails: A Tutorial to the Chewy Gem by Core Toptal Software Engineer Arkadiy Zabazhanov.