Expert software developers utilize powerful developer tools to work more efficiently and boost productivity. The significance of these tools becomes even more pronounced when it comes to debugging, often considered the most challenging aspect of software development.
This is where React Developer Tools comes in, a browser extension supported by Meta, the company behind React, and used by 3 million developers globally. We will delve into how this tool can enhance your React debugging skills—from examining components, states, and props to monitoring rendering and performance—all without the complexities of browser console logging.
Utilizing React Developer Tools
Front-end web developers regularly encounter the need to identify the root cause of intricate issues within applications. A common approach involves utilizing numerous console.log statements and reviewing the browser’s console. While this method can be effective, it lacks efficiency. Luckily, React Developer Tools simplifies this process and empowers us to:
- Visualize the React component tree.
- Inspect and modify the state/props of any component within the tree.
- Monitor the rendering time of a component.
- Determine the reasons behind a component’s re-rendering.
These features enable you to optimize an app, uncover bugs, and pinpoint other problems effortlessly.
Installing the Extension
To begin, let’s add the React Developer Tools extension to your browser by following these six steps. Our focus will be on Chrome, but similar procedures apply to other browsers (Firefox, Edge, etc.):
- Navigate to the Chrome plugin page.
- Click on Add to Chrome.
- Click on Add extension in the pop-up that appears.
- Wait for the download to finish.
- Click on the extensions (puzzle) icon in the top right corner of your browser.
- Click on the pin icon for easy access to the extension.
Now, the icon you pinned in step 6 will change its appearance whenever you visit a website built with React:
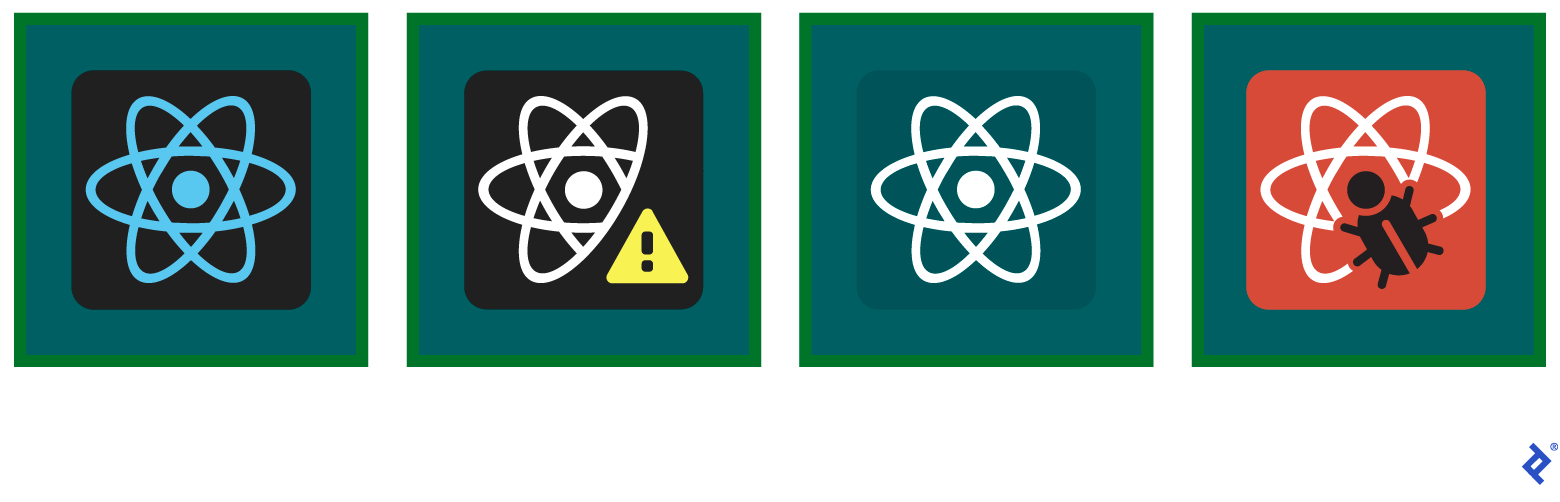
From left to right, these icons indicate when a page:
- Utilizes the production build of React (e.g., https://reactjs.org/).
- Utilizes an outdated version of React (e.g., https://mozilladevelopers.github.io/playground/).
- Does not use React (e.g., Google).
- Is part of a development environment (we’ll see this logo in our test application).
With the extension set up, let’s create an application for debugging.
Setting up a Test Application
The create-react-app utility tool can effortlessly set up an app in seconds. Ensure you have install Node.js installed, then use your command line to create your app:
| |
This might take a moment, as it involves initializing the codebase and installing dependencies. Once done, go to the application’s root folder and launch your React app:
| |
Once compiled, your app will open in your browser:

The React Developer Tools extension icon now indicates that we’re in the development environment.
Practical Debugging Techniques Using React Developer Tools
Let’s explore the developer tools themselves. Start by opening the developer console (Option + ⌘ + J on Mac or Shift + CTRL + J on Windows/Linux). Among the available tabs (Elements, Console, etc.), we’ll be using the Components tab:
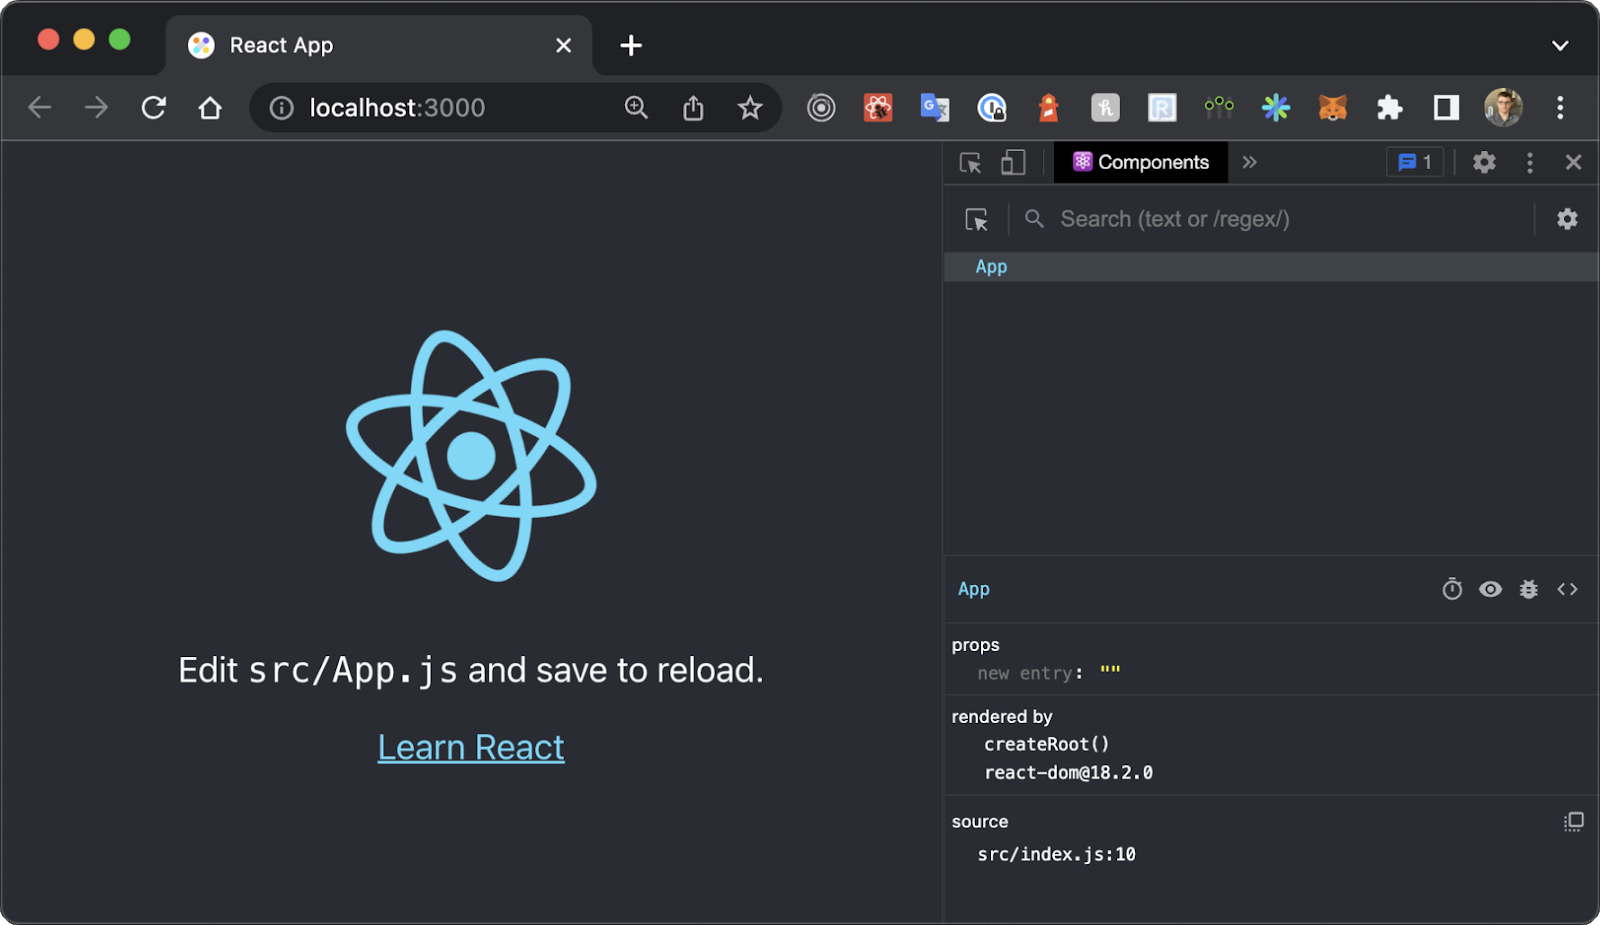
Currently, there’s only one component displayed. This is because our test application has rendered only one component, App (see src/index.js). Click on the component to view its props, the react-dom version in use, and the source file.
Monitoring Component State
Let’s begin with the most frequently used feature: examining and modifying a component’s state. To demonstrate, we’ll make changes to our test project. We’ll replace the React placeholder homepage with a basic login form containing three state elements: a username string, a password string, and a boolean for a “Remember me” setting.
In the src folder, delete App.css, App.test.js, and logo.svg. Then create a new file, LoginForm.js, and add the following code:
| |
Notice how we declare the component. We’re using a named component (const LoginForm => …) to see its name in the dev tools. Anonymous components would show up as Unknown.
LoginForm will be our debugging target, so let’s render it inside App.js:
| |
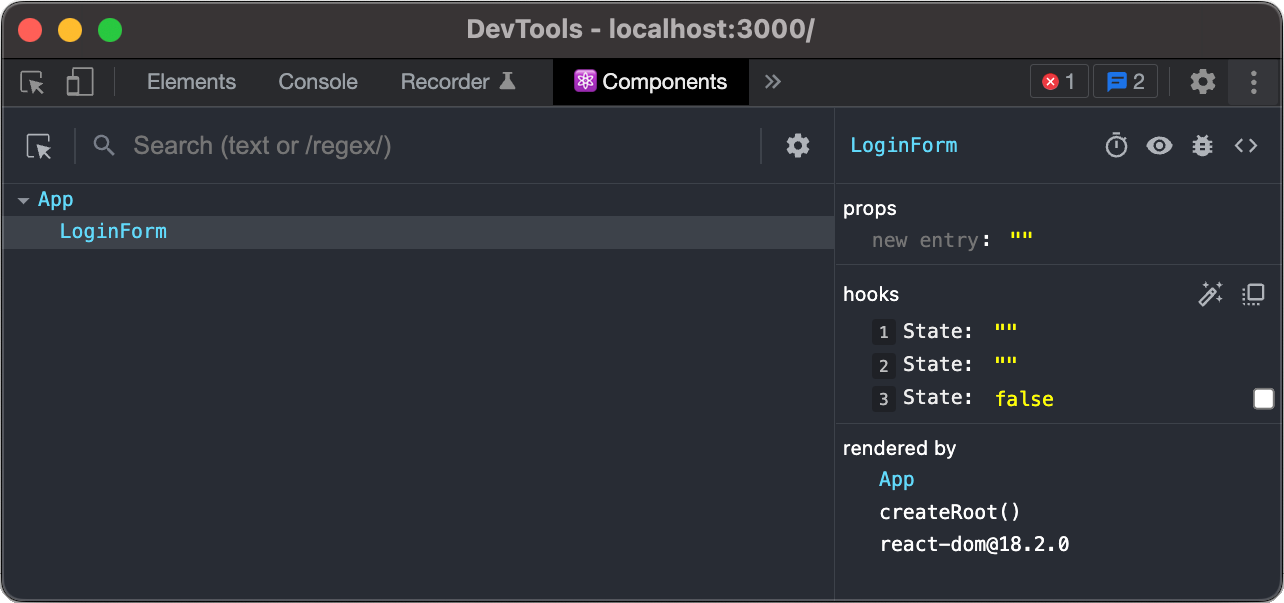
Reload the browser window with the Components tab open. Now, beside the App component, you’ll find the LoginForm component. Clicking on LoginForm reveals all the state items we defined using useState hooks. Since we haven’t interacted with any input fields or checkboxes, we see two empty strings and false:
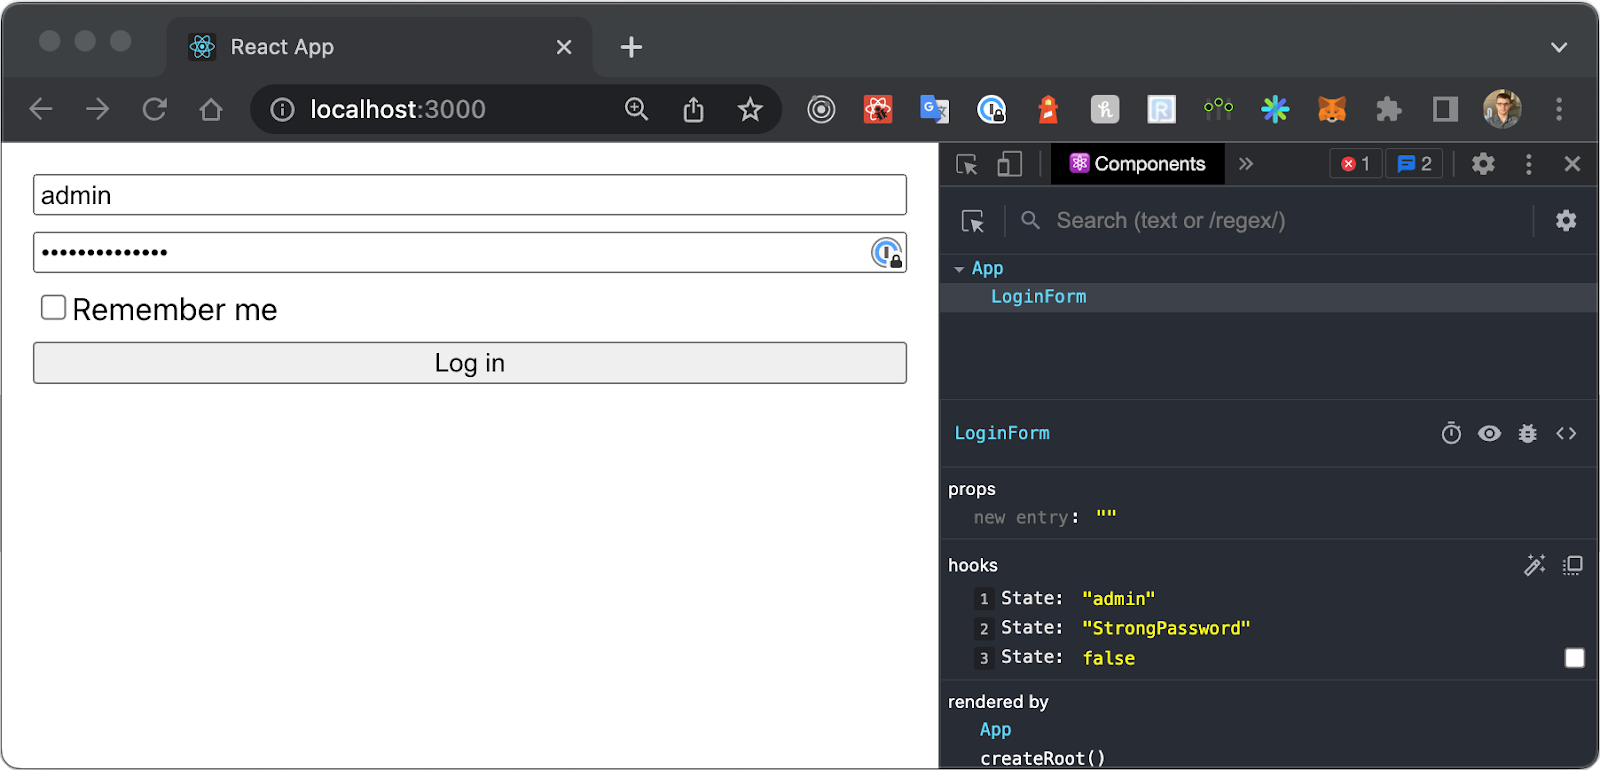
Enter any text in the username and password fields or toggle the checkbox to observe the values updating in the debugging window:
You might notice that the state variables lack names, all appearing as State. This is expected behavior because useState only accepts the value argument ("" or false in our case). React doesn’t inherently know the name of the state item.
However, a utility called useDebugValue partially addresses this. It allows setting display names for custom hooks. For instance, you could set the display name Password for a custom usePassword hook.
Tracking Component Props
We can monitor not only state changes, but also component props. Let’s modify LoginForm further:
| |
This adds a defaultUsername property to pre-fill the username on initial load, and an onSubmit property to handle form submission actions. We also need to set default values for these properties in App:
| |
After saving these changes, reload the page. You’ll now see the props within the Components tab:

If you need to check how the component reacts to different state/props, you can do so without changing the code. Simply click on the state/prop value in the Components tab and input the desired value.
Analyzing Application Performance
It’s important to note that tracking props and state is possible through console.log. However, React Developer Tools offers two key advantages:
- Firstly, relying on console logs becomes impractical when a project grows in scale. Managing numerous logs makes finding specific information difficult.
- Secondly, monitoring component states and properties is only one aspect. When an application functions correctly but experiences slowness, React Developer Tools can pinpoint performance bottlenecks.
For a general performance overview, React Developer Tools can highlight DOM updates. Click on the gear icon in the top right corner of the Components tab.
This opens a pop-up with four tabs. Select the General tab and check the Highlight updates when components render option. Now, when you type in the password field, you’ll see the form highlighted with a green/yellow frame. The more frequent the updates, the brighter the highlight becomes.

For a more detailed performance breakdown, switch from the Components tab to the Profiler tab (and uncheck the highlight option).
You’ll notice a blue circle in the top left corner of the Profiler tab. This button initiates application profiling. Clicking it will track all state/prop updates. Before proceeding, click the gear icon in the top right corner of the tab and enable Record why each component rendered while profiling. This provides explanations for each update.

With the configuration done, let’s profile our app. Close the settings and click the blue circle. Start typing in the password field and toggle the “Remember me” checkbox. Click the blue circle again to stop profiling and view the results.

The profiling results display itemized updates for the LoginForm component. In our case, it shows nine updates: eight for each character typed in the password field, and one for the “Remember me” checkbox. Clicking on an update reveals why the re-render occurred. For instance, the first render states “Hook 2 changed.”
Looking at the second hook in our LoginForm component:
| |
The result aligns with our expectation, as the second hook manages the password state. Clicking the last render would show “Hook 3 changed” because our third hook handles the “Remember me” state.
Inspecting React useReducer and Context
The previous examples illustrate simple scenarios. However, React’s API includes more complex features like Context and useReducer.
Let’s incorporate these into our application. First, we’ll add a file for our context. This context will handle user login logic and provide related information. Create AuthenticationContext.js with the following code:
| |
This context provides the loading status, error, result (token), and the login action (logIn). As you can see in the reducer function, initiating login sets the loading value to true. The token gets updated upon successful response; otherwise, an error is set. We don’t need a separate success status because the presence of a token implies success.
To use these values in our app, update App.js:
| |
Now, reload the page and go to the Components tab. You’ll see the context in the component tree:
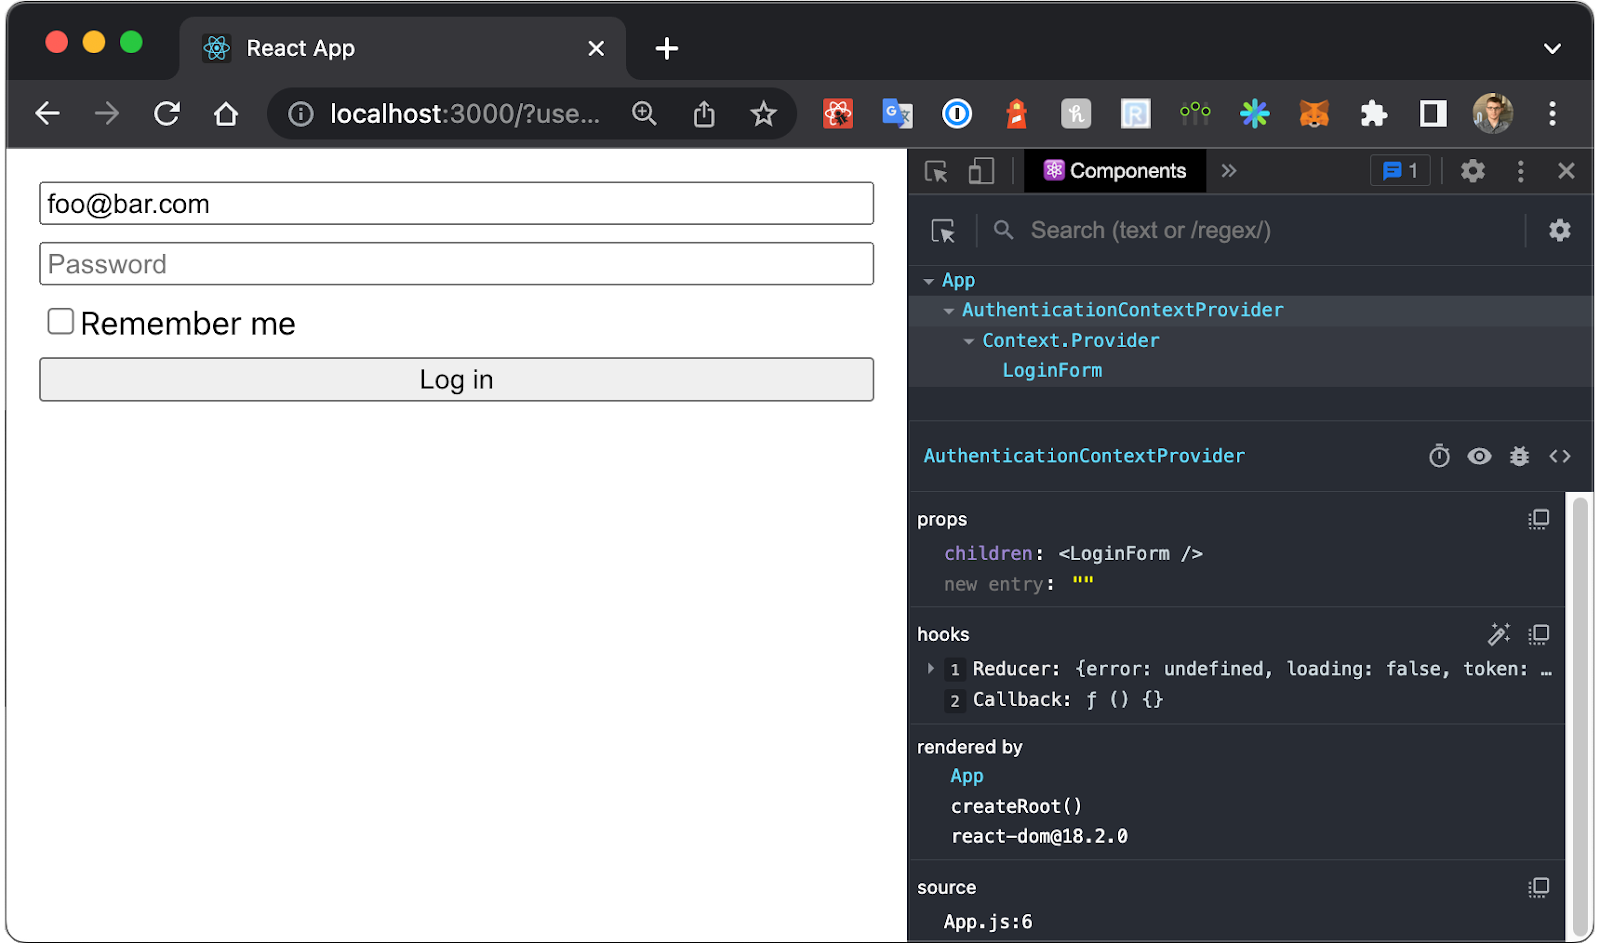
Two new nodes have appeared: AuthenticationContextProvider and Context.Provider. The first is our custom provider wrapping the application in App.js. It contains the reducer hook with the current state. The second node represents the context itself, showing the value being provided to the component tree:
| |
To ensure React Developer Tools can track reducer changes and display the actual context state, modify LoginForm.js to use the logIn action as the onSubmit callback:
| |
Now, in the browser, click Log in to see the token value (previously undefined) update in Context.Provider’s props.
Additional React Debugging Tools
Debugging React applications extends beyond React Developer Tools. Developers can leverage various utilities and their feature sets to create a customized debugging process.
Why Did You Render
First up is why-did-you-render, a powerful performance analysis tool. While not as straightforward as React Developer Tools, it enhances render monitoring by providing human-readable explanations for each render, including state/prop differences and suggestions for improvement.

Redux DevTools
Redux is a popular state management library often used with React. To learn more, you can refer to my previous article. In essence, it consists of actions and states. Redux DevTools is a user interface that visually represents the actions triggered in your app and the resulting state changes. Here’s an example of the add-on in action on a Medium webpage:

Streamlined Problem-solving for Your Projects
React Developer Tools is a simple yet effective addition to your workflow, simplifying the process of resolving issues. While other tools might be beneficial depending on your needs, React Developer Tools is an excellent starting point.
With your newfound React Developer Tools skills, you’ll become proficient in debugging your next app and be able to navigate any React-based page or application significantly faster than traditional code inspection methods.
The Toptal Engineering Blog editorial team extends its thanks to Imam Harir for reviewing the code samples and technical content presented in this article.