It’s time! Google Analytics 4 (GA4), the future of web analytics, has arrived.

You might have heard whispers, but let’s be clear: Universal Analytics (UA) will stop collecting data in July 2023. GA4 is the only option moving forward.
Why this shift? How will it impact your business? This guide dives into the evolution of Google Analytics, contrasting UA and GA4, and providing insights, tips, and strategies for a smooth transition.
Table of contents
- A Look Back: Google Analytics Through the Years
- UA vs GA4: Data Collection & Privacy
- UA vs GA4: Reporting Insights
- Unlocking GA4’s New Features
A Look Back: Google Analytics Through the Years
For all you analytics enthusiasts, here’s a trip down memory lane, from Urchin in 2005 to the arrival of Google Analytics 4 in 2020. 2005: Google acquired a platform called Urchin. Urchin transformed raw log files into something more understandable, back when log files were our sole data source.
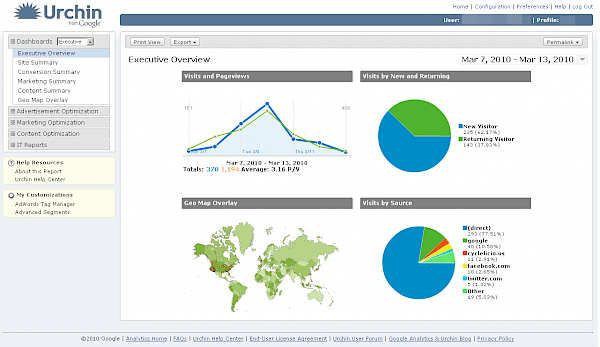 Image source
2006: Google reimagined and launched the platform as Google Analytics.
2012: Google Analytics is discontinued and replaced by Universal Analytics. Universal Analytics revolutionized tracking, offering cross-platform and device-specific insights while empowering users to create custom dimensions and metrics. This was essential as apps and mobile browsing gained popularity, and businesses sought ways to optimize for this evolving landscape.
Image source
2006: Google reimagined and launched the platform as Google Analytics.
2012: Google Analytics is discontinued and replaced by Universal Analytics. Universal Analytics revolutionized tracking, offering cross-platform and device-specific insights while empowering users to create custom dimensions and metrics. This was essential as apps and mobile browsing gained popularity, and businesses sought ways to optimize for this evolving landscape.
 2018: Europe introduced GDPR, its landmark data privacy and security regulations, General Data Protection Regulation (GDPR). These regulations protect European citizens’ data both within Europe and on websites they visit globally, regardless of where the site is hosted.
(Disclaimer: I am not a privacy expert. It’s crucial for all businesses to consult with privacy experts and legal professionals to ensure compliance with all relevant laws.)
The GDPR’s data standards led to Google Analytics being deemed illegal in France, putting countless businesses at risk of hefty fines for their use of the platform. Soon, other regions, including New Zealand, Japan, Brazil, California, and more, established their own privacy laws. As regulations expanded, Google had to adapt how it collected, stored, and managed data.
October 2020: Driven by increasing privacy and security concerns, Google launched Google Analytics 4 (GA4). This new platform incorporates features and tools for enhanced data control. Google even went so far as to say that GA4 was built for privacy.
2018: Europe introduced GDPR, its landmark data privacy and security regulations, General Data Protection Regulation (GDPR). These regulations protect European citizens’ data both within Europe and on websites they visit globally, regardless of where the site is hosted.
(Disclaimer: I am not a privacy expert. It’s crucial for all businesses to consult with privacy experts and legal professionals to ensure compliance with all relevant laws.)
The GDPR’s data standards led to Google Analytics being deemed illegal in France, putting countless businesses at risk of hefty fines for their use of the platform. Soon, other regions, including New Zealand, Japan, Brazil, California, and more, established their own privacy laws. As regulations expanded, Google had to adapt how it collected, stored, and managed data.
October 2020: Driven by increasing privacy and security concerns, Google launched Google Analytics 4 (GA4). This new platform incorporates features and tools for enhanced data control. Google even went so far as to say that GA4 was built for privacy.
 March 2022: Google made a significant announcement, announces, stating that Universal Analytics would cease collecting new data as of July 1, 2023, making the switch to GA4 essential.
NOTE: Even though this switch isn’t happening for another year, it’s important to note that your data will not migrate over from UA to GA4. So if you want to have a year’s worth of historical data, your best bet is to switch to GA4 now
To delve deeper, explore our blog post on this announcement. So, how does GA4 differ from UA? Let’s break down the key distinctions.
UA vs GA4: Data Collection & Privacy
First and foremost, let’s examine how UA and GA4 differ in handling user data and data sources.
Privacy
- No More IP Addresses. A key change in GA4 is that IP addresses are no longer collected or stored. While Universal Analytics allowed you to view IP addresses unless specifically anonymized, GA4 prioritizes user privacy by omitting them.
- Simplified data deletion, empowering admins to delete data upon user request, ensuring greater data control.
- Data retention options provide flexibility in how long GA4 retains user-specific data. While the default is two months, you can extend it up to 14 months. (Importantly, this doesn’t limit your data access to 14 months; only user-specific data beyond that period is impacted.)
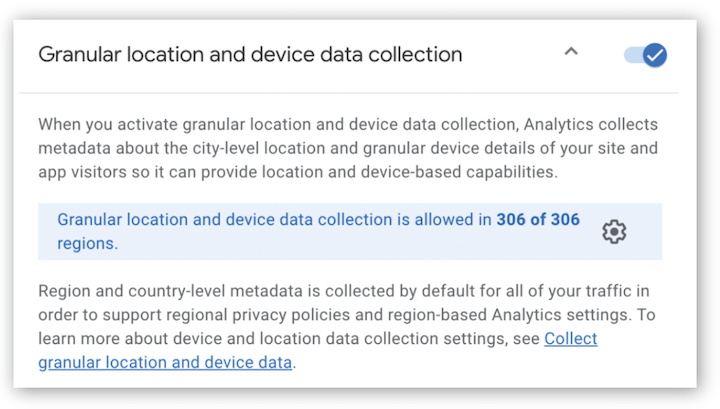
- Control Over Location Data. GA4 offers options to disable location-specific data and ad personalization data based on country, enhancing user privacy.
Data Streams for Today’s Omnichannel World
Beyond privacy and security, data collection differences in GA4 provide a more complete view of the user journey. Remember, Universal Analytics was launched back in 2012. Back then, 45% of individuals owned smartphones, the App Store had a mere 540,000 apps, and e-commerce spending reached $225.5 billion. The traditional marketing funnel, emphasizing awareness, interest, desire, and action, focused solely on acquiring new customers, with little attention to retention. Fast forward to early 2021: 85% of people owned smartphones, the App Store boasted 4.5 million apps, and e-commerce spending in 2019 alone reached $578.50 billion. Moreover, with Google’s mobile-first indexing, “mobile websites” are largely a thing of the past. These shifts ushered in the era of the marketing flywheel. This model prioritizes customer retention and turning them into advocates (as we discussed in our growth marketing post).
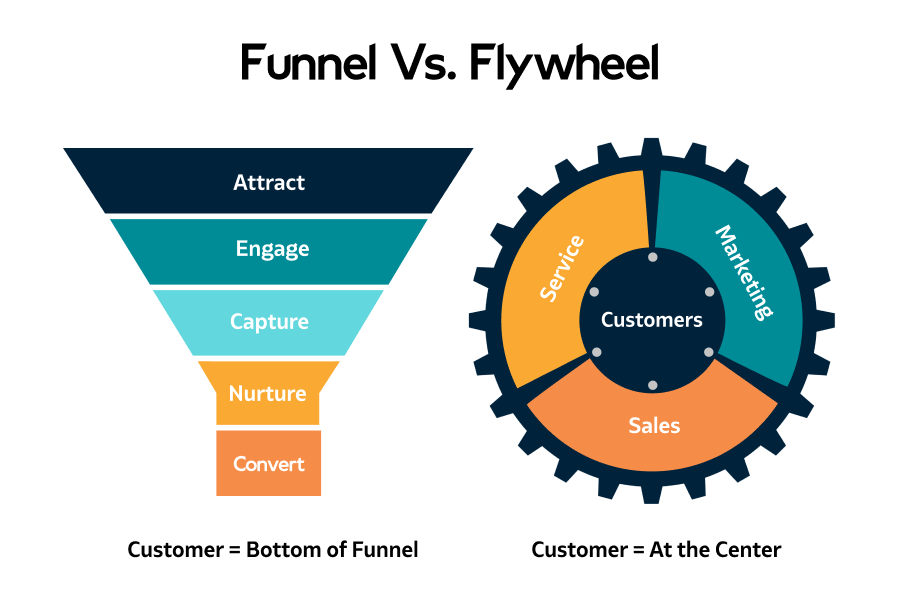 Image source
One of the key ways GA4 addresses the modern user journey is through Data Streams.
Data Streams are the sources that collect and send data to your Google Analytics property. In GA4, you can have multiple data streams feeding a single property. So, whether you have two websites or a website and an app, you can see how users interact with all your properties in one central location.
Image source
One of the key ways GA4 addresses the modern user journey is through Data Streams.
Data Streams are the sources that collect and send data to your Google Analytics property. In GA4, you can have multiple data streams feeding a single property. So, whether you have two websites or a website and an app, you can see how users interact with all your properties in one central location.
UA vs GA4: Data & Reports
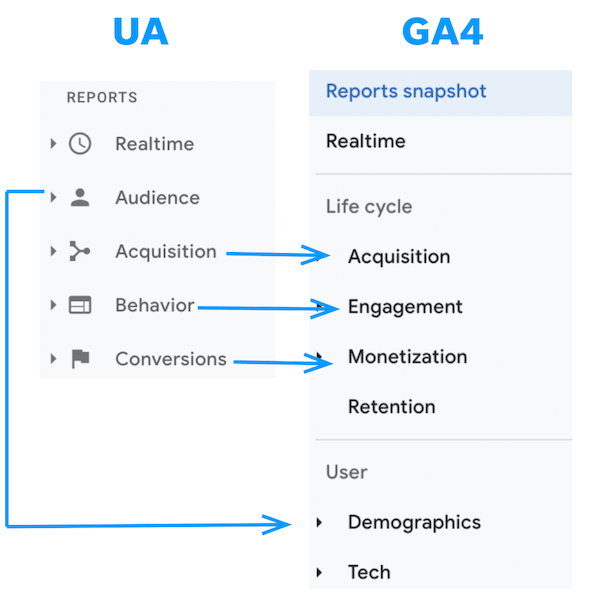
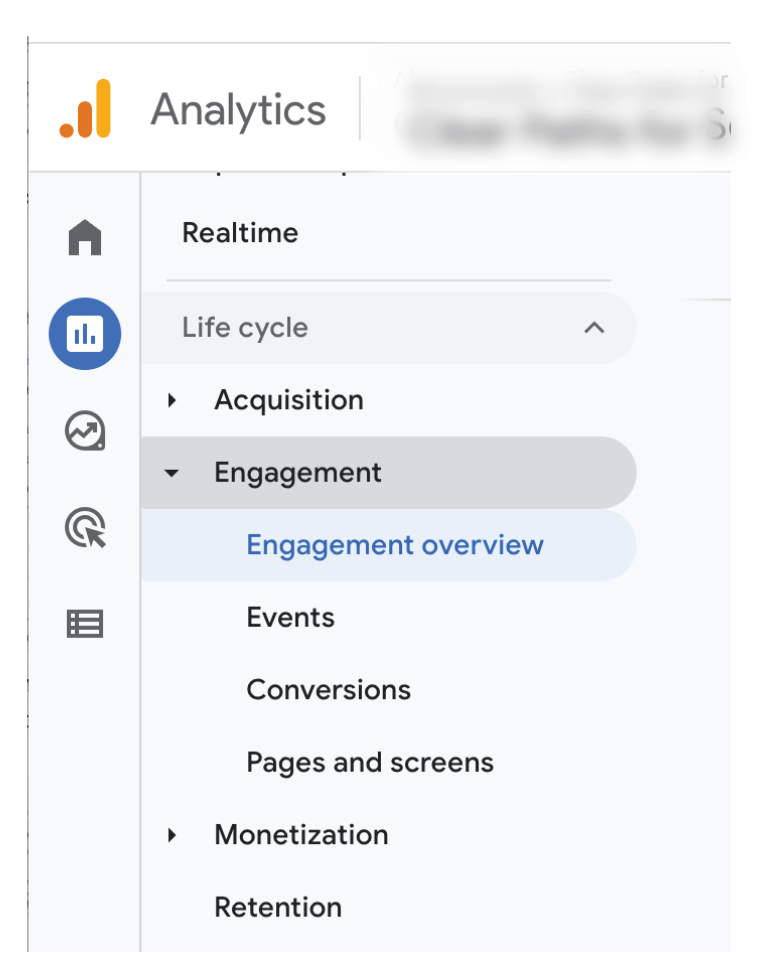
When comparing data available in Universal Analytics and Google Analytics 4, not much has drastically changed. While it might appear GA4 has more user information, UA captures much of the same data, often tucked under the “Audience” tab. The most noticeable difference lies in the terminology surrounding “engagement” and “monetization,” as well as the introduction of “retention.”
- “Engagement” has replaced “behavior” but covers similar ground, adding reports on conversions (previously known as “goals”).
- “Monetization” is a new addition that we’ll delve into later. As we mentioned, there’s been growing emphasis on retaining customers and fostering advocacy. GA4 prominently features “retention” within its Life Cycle report, reflecting its significance. While this section might seem limited now, expect future updates as GA4 evolves.
Users vs Traffic
Just a quick reminder: a “user” refers to a unique individual visiting your site. Whether they visit once on their phone and three times on their computer, they remain a single user. “Traffic,” on the other hand, represents sessions. GA4 splits user acquisition and traffic acquisition into distinct reports.
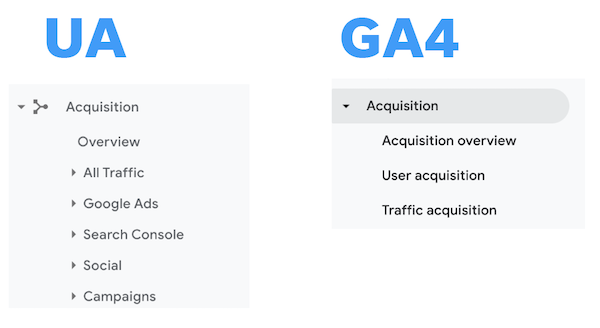 Importantly, this results in separate acquisition dimensions for users and sessions, so pay close attention when selecting dimensions for your reports.
Behavior vs Engagement Metrics
Universal Analytics incorporated behavior metrics like bounce rate, pages/session, and average session duration across various reports.
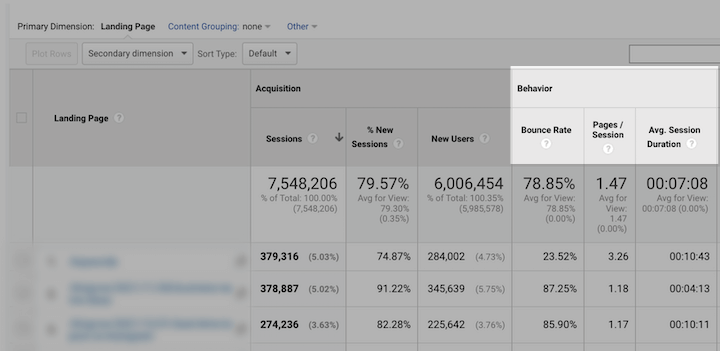 Google Analytics 4 replaces these with new “engagement” metrics based on “engaged sessions,” which Google defines as sessions exceeding 10 seconds, involving a conversion event, or having two or more screen or page views.
These new metrics include:
Google Analytics 4 replaces these with new “engagement” metrics based on “engaged sessions,” which Google defines as sessions exceeding 10 seconds, involving a conversion event, or having two or more screen or page views.
These new metrics include:
- Engaged sessions
- Engagement rate
- Engaged sessions per user
- Average engagement time Yes, you read that right—say goodbye to bounce rate! >> July update: Bounce rate has been added back in, alongside conversion rate and UTM parameters!
Monetization
“Monetization” reports now occupy the space previously held by “conversions” reports. Keep in mind that “monetization” in 2021 is a different beast from its 2012 counterpart.
Traditionally, “monetization” was synonymous with e-commerce. Today, it encompasses ad revenue, in-app purchases, and more. GA4’s monetization reports consider all these revenue streams.
One downside: if your site doesn’t track direct monetary value, this entire GA4 section is rendered useless.
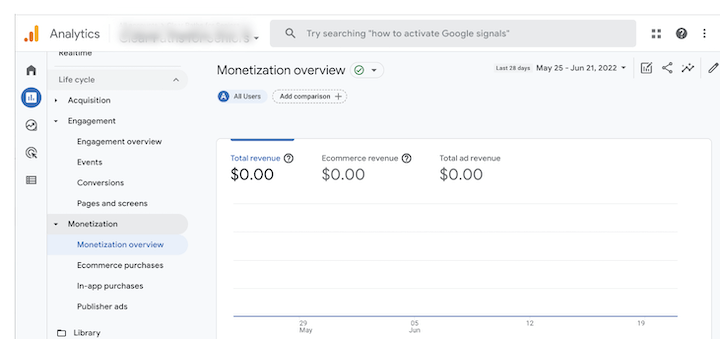 This is unfortunate, as UA’s conversion reports weren’t solely focused on money; they also tracked non-monetary conversions and their attribution.
Session-Based Data vs Event-Based Data
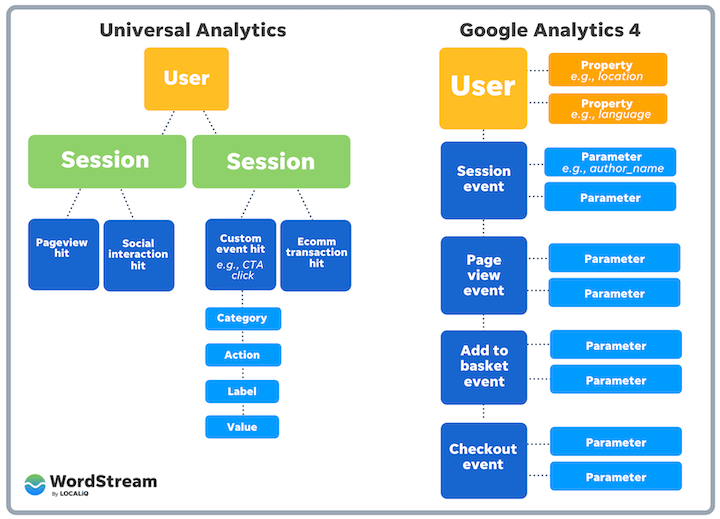
Universal Analytics collected session-based data. Each session comprised various “hit types” such as page hits, ecommerce hits, social interaction hits, and more. In contrast, GA4 is an event-driven platform, where every interaction is considered an event: First visit? Event. Pageview? Event. And so on.
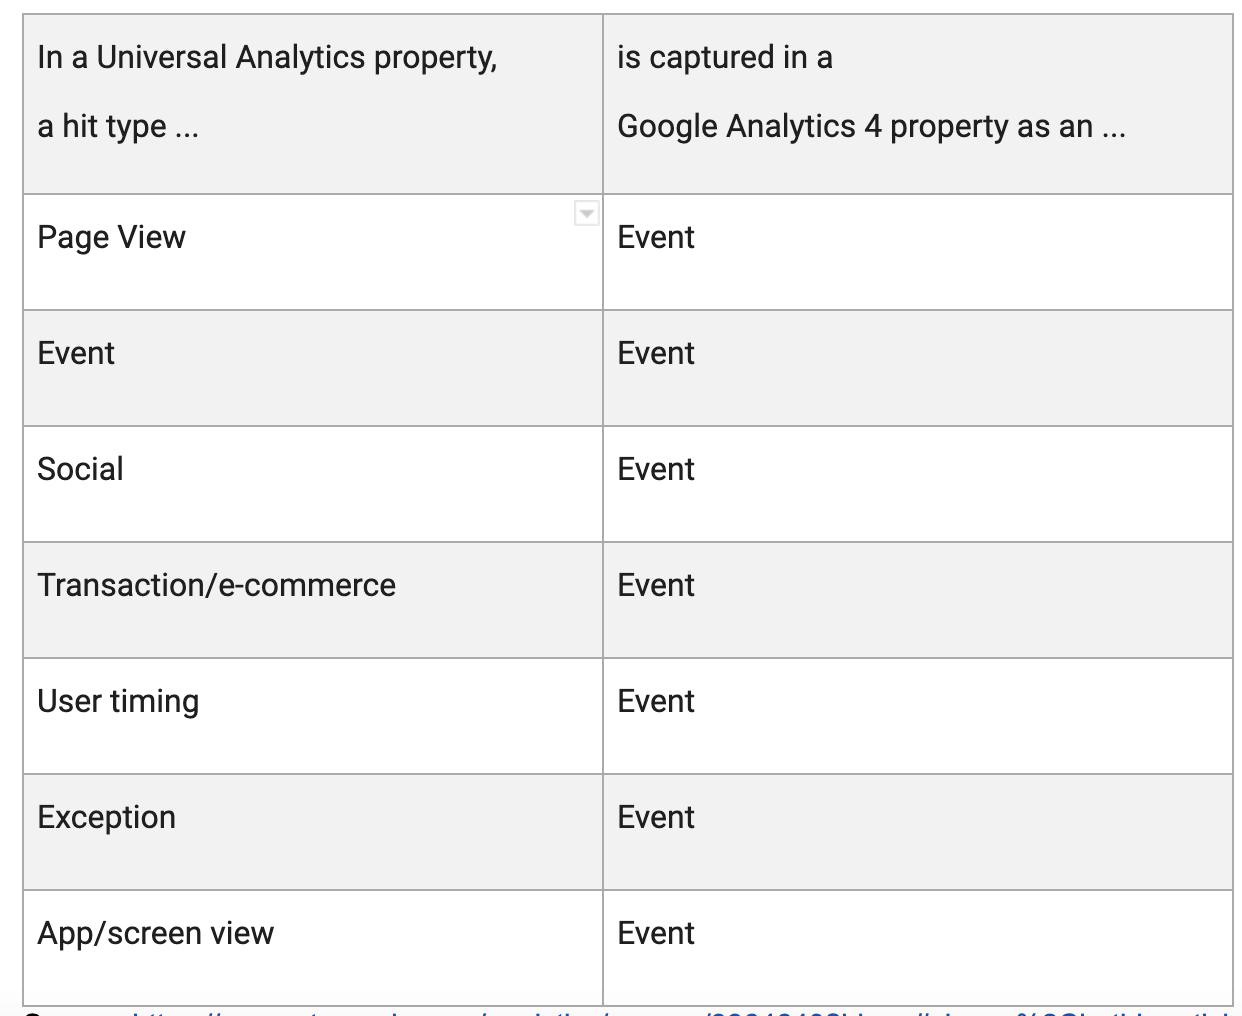 Image source
This shift is valuable as it provides deeper insights into how users interact with your properties. The downside is that UA and GA4 datasets aren’t directly comparable…
Hence, you start fresh when transitioning from UA to GA4.
Image source
This shift is valuable as it provides deeper insights into how users interact with your properties. The downside is that UA and GA4 datasets aren’t directly comparable…
Hence, you start fresh when transitioning from UA to GA4.
Creating Events & Conversions
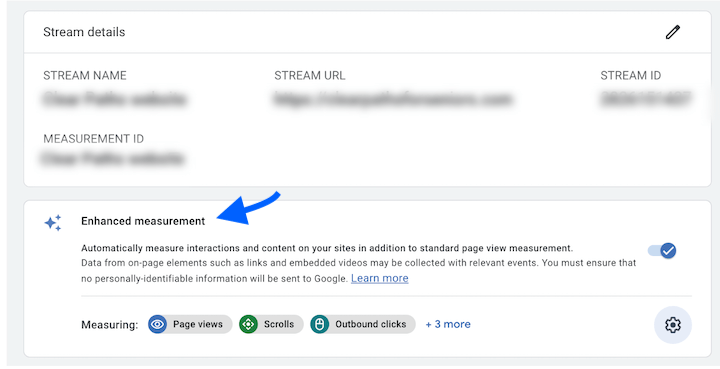
Not only are events handled differently in GA4, but the way they’re passed to the platform has also evolved. Gone are the days of action, category, and label. GA4 introduces parameters, enhanced measurement, and in-platform event creation. When setting up your Data Stream, you can enable “enhanced measurement,” which automatically captures page views, downloads, outbound clicks, video engagement, and scrolls. With enhanced measurement activated, these events are collected automatically—no extra effort required!
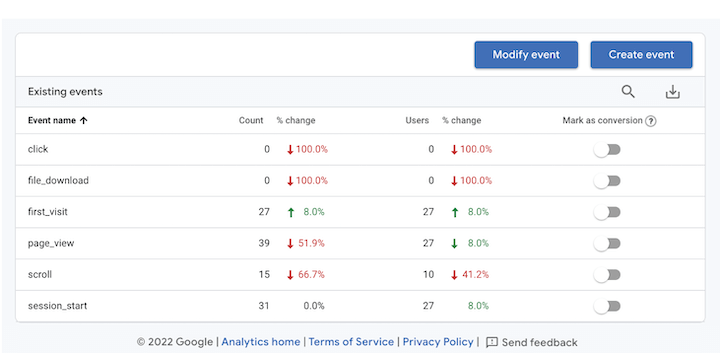
 For events not covered by enhanced measurement, GA4 lets you define them directly within the platform using conditions and parameters. Parameters are bits of information accompanying events, providing context about the user or their action.
Once an event is tracked, marking it as a conversion is as simple as toggling a button—no more complex “Goal” setups!
For events not covered by enhanced measurement, GA4 lets you define them directly within the platform using conditions and parameters. Parameters are bits of information accompanying events, providing context about the user or their action.
Once an event is tracked, marking it as a conversion is as simple as toggling a button—no more complex “Goal” setups!
Increased Functionality in Google Analytics 4
When initially setting up GA4, be sure to explore the full range of options within the “property” settings. We’ve touched upon many, but it’s worth familiarizing yourself with them all.
Product Links
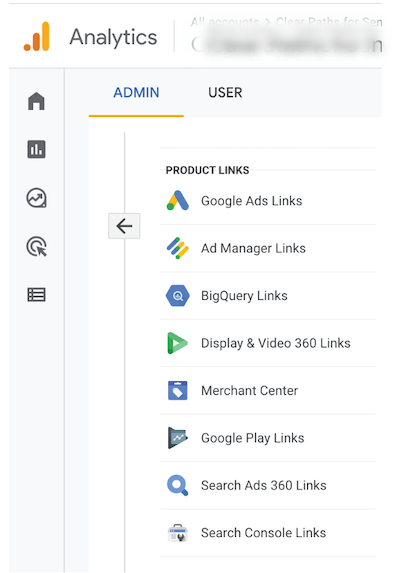
Under property settings, you’ll find “Product Linking,” a feature you might have encountered in other Google products like Search Console or Google Ads. Product Linking connects data across Google products, and in GA4, it offers native, free integration with Google Merchant Center, Google Optimize, and BigQuery!
Customizable to Your Needs
Perhaps GA4’s most understated feature is its customization flexibility to align with your specific requirements. Not only can you create custom reports like in UA, but GA4 lets you add these reports directly to your navigation menu. No more navigating to separate sections! If you create a report, you choose where it resides within the Reports navigation.
 GA4 offers further customization, allowing you to rename collections and topics in the secondary navigation using the Library (not to be confused with the Google Ads library).
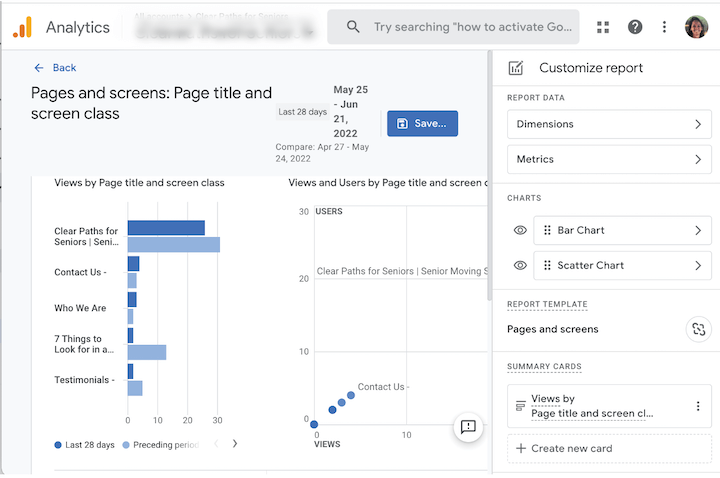
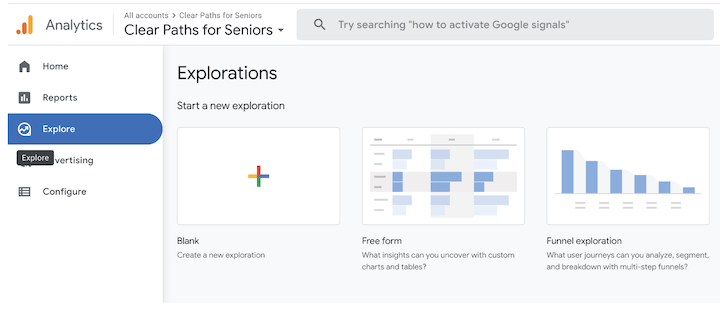
Explorations: Your Analytics Canvas
GA4’s Explorations feature enables you to build dashboard-like reports. Think of Explorations as a fusion of UA’s custom dashboards with the user-friendly interface of Data Studio.
Machine Learning Powerhouse
Universal Analytics hinted at machine learning’s potential with the introduction of “Insights” in 2018, helping users uncover trends and anomalies in their data. Over time, these capabilities grew more sophisticated, allowing users to query data using natural language. GA4 integrates machine learning even more deeply. Insights are prominent throughout the platform, and new machine learning tools take center stage!
Anomaly Detection at Your Fingertips
Anomaly detection, once limited to Insights, is now available on most line charts, visually highlighting statistical deviations in your data. For anomaly detection to function, Google needs sufficient historical data for predictive modeling, leading to the next exciting tool—predictive analytics!
Predictive Analytics, Now Standard
Previously, accessing predictive analytics often meant investing in third-party tools or building your own. GA4 changes that, introducing built-in predictive analytics for LTV, churn probability, likely churners, likely top spenders, likely purchases, purchase probability, and more.
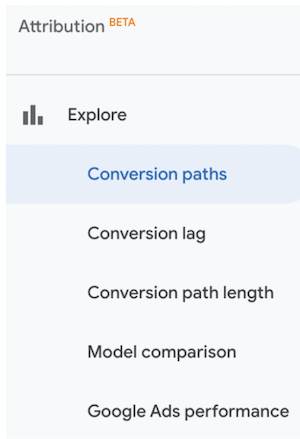
Attribution Evolved
Google has been refining its attribution tools for years. Universal Analytics saw the arrival of multi-channel funnel tools, followed by the Attribution Project in December 2019, offering a suite of attribution and conversion analysis features. In GA4, the primary navigation now houses an “Advertising” section, containing the same tools from the Attribution Project: conversion paths, time to conversion, model comparison, and touchpoints to conversion. But GA4’s attribution advancements don’t stop there. Recently, Google announced that all users would gain access to its data-driven attribution model. Consequently, all GA4 properties now utilize this model as their default, while UA still relies on last-click attribution.
A World of Discovery Awaits
Here’s the key takeaway: we’re only scratching the surface of GA4’s potential. Like all things Google, it’s constantly evolving! There’s much more to learn and uncover, and this journey will be unique for everyone. Our advice? Dive into GA4 and explore. It might feel unfamiliar initially, but it’s more intuitive than you might think, just a tad more advanced. And who can argue with that?