Working with data in memory often leads to messy, complicated code. Even though the data operations might be straightforward—grouping, summarizing, building hierarchies, doing calculations—things get tricky when you need to use the processed data in different parts of your application. You might need a slightly different version of the data, or you might need to add more information like metadata, context, or related data. This is especially true for visualizations and reports. You painstakingly shape the data for one specific purpose, and then realize you need to handle tooltips, linked highlights, or drill-downs, which throws a wrench in your well-laid plans.
There are a few ways people typically tackle this:
- Overstuffing: Cram extra details and levels into the processed data until it becomes bulky and unwieldy, but at least it satisfies all the different parts of the application that use it.
- Re-processing: Write new data transformation functions that have to reconnect with the original data source to fetch additional details.
- Over-engineered Objects: Design complex object classes that are supposed to magically handle all the different situations they might encounter.
Having spent 20 or 30 years building data-heavy software, you start to realize you’re stuck solving the same problems repeatedly. We resort to complex loops, list comprehensions, database functions, mapping and grouping functions, or even full-blown reporting engines. While our coding skills improve, and we get better at writing efficient and elegant data manipulation code, the fundamental problem of messy, interconnected code persists.

This article explores the JavaScript library Supergroup.js, which offers powerful functions for collecting, manipulating, grouping, and summarizing data in memory. We’ll see how it can help you tackle common data manipulation tasks when dealing with smaller datasets.
The Problem
On my first Toptal project, I joined a team working on a D3.js application for analyzing marketing data. The application already had a visually appealing grouped/stacked bar chart and needed a choropleth map visualization. The bar chart could display 2, 3, or 4 arbitrary dimensions, internally referred to as x0, x1, y0, and y1, with x1 and y1 being optional.

The code was riddled with references to x0, x1, y0, and y1—in legends, filters, tooltips, titles, and calculations of totals or year-to-year differences. Conditional logic was scattered everywhere to handle the optional dimensions.
It could have been worse, though. The code could have directly referenced specific data fields (like year, budget, tier, product category, etc.). At least it generalized things to the display dimensions of that particular bar chart. But when a new chart type was needed—one where x0, x1, y0, and y1 didn’t make sense—a substantial chunk of the code had to be rewritten from scratch, including code for legends, filters, tooltips, titles, summary calculations, chart construction, and rendering.
Nobody wants to tell their client, “I know it’s just my first day, but before I implement what you asked for, can I refactor all your code using this JavaScript data manipulation library I wrote?” Luckily, I was spared this awkward conversation. I was introduced to a client programmer who was about to embark on a refactoring journey anyway. With remarkable open-mindedness, the client invited me to join the refactoring effort through pair programming. He was willing to try Supergroup.js, and within minutes, we were replacing large chunks of convoluted code with concise calls to Supergroup.
The codebase exhibited classic symptoms of the complexities that arise when dealing with hierarchical or grouped data, especially in larger D3 applications. These problems plague reporting applications in general, CRUD applications involving filtering or drilling down, analysis tools, visualization tools—basically, any application dealing with enough data to warrant a database.
In-memory Manipulation
Consider a REST API for faceted search and CRUD operations. You might end up with multiple API calls: one to fetch the available fields and values for search parameters (possibly with record counts), another to retrieve a specific record, and others to get groups of records for reporting. On top of that, you likely need to apply temporary filters based on user selections or permissions.
If your database is relatively small (tens or hundreds of thousands of records) or you can easily narrow down the data you’re working with, you could potentially ditch your entire convoluted REST API (except for permissions) and have a single call that simply says, “Give me all the records.” We live in a world with fast compression, fast data transfer, ample memory on the client-side, and speedy JavaScript engines. Creating complex query schemes that both client and server need to understand and maintain is often unnecessary. People have even created libraries to run SQL queries directly on collections of JSON records, as the optimizations of a full-blown relational database are often not needed.
But even that can be overkill. At the risk of sounding overly ambitious, Supergroup is often easier to use and more powerful than SQL.
Essentially, Supergroup is like d3.nest, underscore.groupBy, or underscore.nest on steroids. It leverages lodash’s groupBy function for grouping. Its core strategy is to transform every piece of original data into metadata and provide readily accessible links to the rest of the data tree at every node. Each node or list of nodes is enhanced with a rich set of convenient functions, making it possible to access almost any information you need from any point in the tree using concise expressions.
Supergroup in Action
To illustrate Supergroup’s elegant syntax, I’ve borrowed a snippet of code from Shan Carter’s Mister Nester. A basic two-level nesting using d3.nest looks like this:
| |
Here’s the equivalent using Supergroup:
| |
That final call to d3NestMap() simply converts the Supergroup output into the same format (which I personally find not very practical) as D3’s nest.map():
| |
I say “not very useful” because D3 selections work best with arrays, not maps. In this map-based data structure, what exactly constitutes a “node”? Entries like “1970” or “6001” are just strings—keys into a map at the top or second level. So, a node would be what these keys point to. “1970” points to another map (at the second level), while “6001” points to an array of raw data records. This map-based nesting is readable in the console and fine for looking up values, but for D3 operations, you need array-based data, which is why you’d use nest.entries() instead of nest.map():
| |
Now we have nested arrays of key/value pairs: the 1970 node has a key of “1970” and a value that’s an array of second-level key/value pairs. Similarly, 6001 is another key/value pair. Its key is a string identifier, but the value is an array of raw data records. We have to handle these second-to-leaf-level nodes and leaf-level nodes differently from nodes higher up in the hierarchy. Moreover, the nodes themselves don’t inherently know that “1970” represents a year and “6001” is a FIPS code, or that this particular 6001 node is a child of the 1970 node. I’ll show how Supergroup addresses these issues, but first, let’s examine the immediate result of a Supergroup call. At first glance, it’s just an array of top-level “keys”:
| |
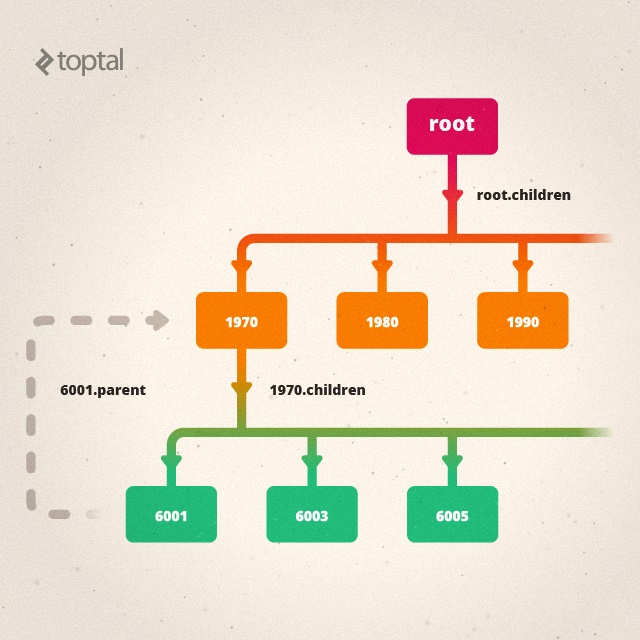
“Okay, that’s interesting,” you might think. “But where’s the rest of my data?” Well, the strings or numbers in the Supergroup list aren’t your ordinary strings or numbers. They are enhanced String or Number objects, equipped with additional properties and methods. For nodes above the leaf level, there’s a children property (you can customize this name) that holds another Supergroup list representing the next level of nodes:
| |
A Tooltip Function That Works Everywhere
To illustrate more features and how this all comes together, let’s create a simple nested list using D3 and build a tooltip function that works seamlessly with any node in the list.
| |
This tooltip function will work for almost any node at any depth in our data. However, since top-level nodes don’t have parents, we can add a workaround:
| |
Now we have a root node that acts as the parent for all the Year nodes. We don’t need to do anything else with this root node, but it ensures our tooltip functions correctly because node.parent will always have a valid reference. Additionally, node.path()[0], which should point to a node representing the entire dataset, now functions as expected.
In case it wasn’t clear from the previous examples, namePath, dimPath, and path provide a path from the root node to the current node:
| |
Aggregate Data On-the-Fly
The tooltip code above used the aggregate method. You call aggregate on a single node, and it takes two arguments:
- An aggregation function that expects an array (typically of numbers).
- Either the name of a field to extract from the records grouped under that node, or a function to apply to each of those records.
There’s also a convenient aggregates method available on lists (either the top-level list of groups or the child groups of any node). It can return either a list or a map of aggregated results.
| |
Arrays that Behave Like Maps
With d3.nest, we often opt for .entries() instead of .map(), as mentioned earlier. This is because “maps” don’t play well with D3 (or Underscore) functions that rely on arrays. However, when you use .entries() to generate arrays, you lose the ability to perform a simple lookup by key value. Supergroup provides the syntactic sugar you need so you don’t have to iterate through an entire array every time you want to access a single value:
| |
Comparing Nodes Across Time
A .previous() method on nodes lets you access the preceding node in a Supergroup list. You can use .sort() or .sortBy() on a Supergroup list (including lists of children under a specific node) to ensure the nodes are in the desired order before calling .previous(). Here’s some code to calculate the year-over-year change in population by FIPS region:
| |
Transforming Tabular Data for D3.js Hierarchy Layouts
Supergroup’s capabilities extend far beyond what I’ve shown so far. For D3 visualizations based on d3.layout.hierarchy, the example code in the D3 gallery often starts with data already structured in a tree format (for instance, the this Treemap example). Supergroup makes it easy to prepare tabular data for d3.layout.hierarchy visualizations (example). You only need the root node returned by .asRootVal() and then call root.addRecordsAsChildrenToLeafNodes(). d3.layout.hierarchy expects the bottom level of child nodes to be an array of raw data records. The addRecordsAsChildrenToLeafNodes method takes the leaf nodes of a Supergroup tree and copies the .records array to a .children property. While not the typical Supergroup approach, it works well for treemaps, cluster layouts, partitions, and other hierarchical visualizations (d3.layout.hierarchy docs).
Similar to the d3.layout.hierarchy.nodes method, which returns all nodes in a tree as a single flat array, Supergroup provides .descendants() to retrieve all nodes starting from a specific node, .flattenTree() to get all nodes starting from a regular Supergroup list, and .leafNodes() to obtain an array containing only the leaf nodes.
Grouping and Aggregating by Multi-Valued Fields
Without delving into exhaustive detail, I’ll mention that Supergroup includes features to address less common but still important scenarios.
Sometimes you need to group by a field that can have multiple values. In a relational or tabular database, multi-valued fields are generally discouraged (they violate first normal form), but they can be useful in other contexts. Here’s how Supergroup handles such a case:
| |
As you can see, with multiValuedGroup, the sum of articlesPublished in the group list is higher than the actual total number of articles published. This happens because the “Sigfried” record is counted twice. Sometimes, this is the intended behavior.
Converting Hierarchical Tables to Trees
Another situation that might arise is working with a tabular structure that represents a tree through explicit parent-child relationships between records. Here’s an example of a small taxonomy:
| p | c |
|---|---|
| animal | mammal |
| animal | reptile |
| animal | fish |
| animal | bird |
| plant | tree |
| plant | grass |
| tree | oak |
| tree | maple |
| oak | pin oak |
| mammal | primate |
| mammal | bovine |
| bovine | cow |
| bovine | ox |
| primate | monkey |
| primate | ape |
| ape | chimpanzee |
| ape | gorilla |
| ape | me |
| |
Conclusion
So there you have it. I’ve been using Supergroup on every JavaScript project I’ve worked on for the past three years. It has consistently solved numerous problems that frequently pop up in data-centric programming. While the API and implementation might not be perfect, I’m always happy to collaborate with anyone interested in improving it.
After a couple of days of refactoring on that client project, I received a message from Dave, the programmer I was working with:
Dave: I must say I’m a pretty big fan of Supergroups. It’s cleaning up a ton.
Sigfried: Yay. I’m going to ask for a testimonial at some point :).
Dave: Hah, absolutely.
If you give it a try and have any questions or encounter any issues, feel free to leave a comment below or open an issue on the GitHub repository.