Assuming you’re reading this, chances are you already understand the importance of conversion optimization. After all, you’ve invested in attracting visitors to your website – why not maximize the number of those visitors who become paying customers? That, in essence, is what conversion optimization is all about.
Many businesses have caught on to this:
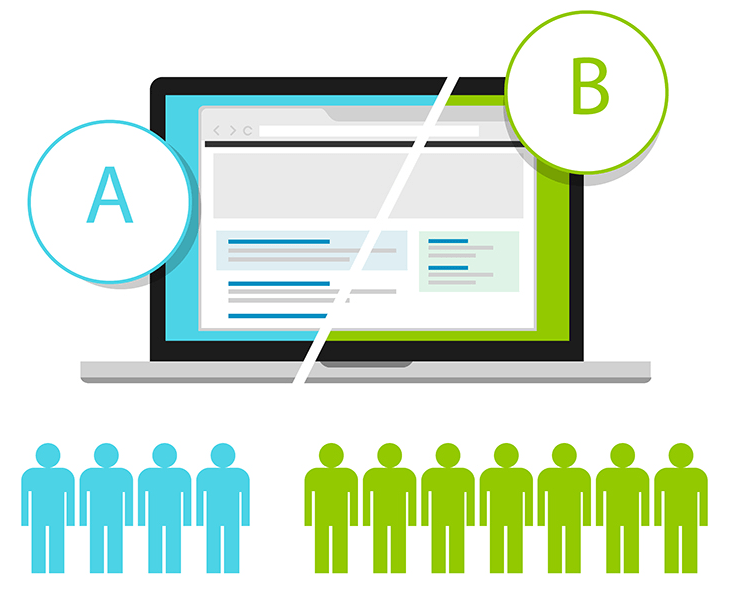
According to Unbounce, by 2013, 44% of businesses were already utilizing split testing software. Sumome proudly claims over 454,482 websites (and growing!) using their tools to boost opt-in conversions. The fear of missing out on this potential is understandable. You might even be tempted to assemble an optimization team and shower them with resources, urging them to “Do something! Anything!” However, as I’ll explain, budgets have limits, and focusing on optimizing the wrong areas can be costly. So, how do you determine where to begin? Should you benchmark your results against industry standards, or should you simply identify a conversion rate that seems “low” and attempt to optimize it? Both approaches, I’d argue, are flawed. Here’s why…
Many industry-specific conversion rates are difficult to interpret
You might have come across statistics similar to these:
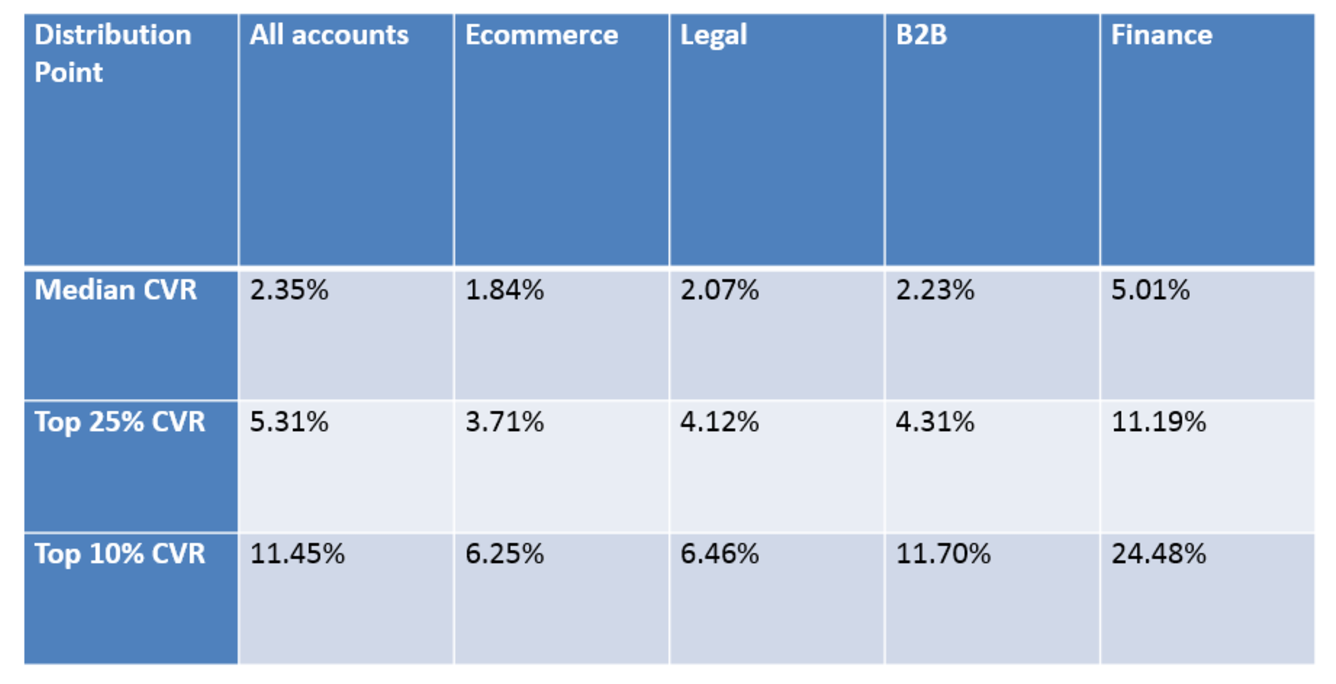
Metrics like these are practically meaningless without understanding where in the funnel they’re being measured. First and foremost, what exactly constitutes a “conversion”? Does it refer to sales in relation to site visitors? Or is it orders in relation to quote requests? These are two distinct conversion rates with significantly different benchmarks.
Furthermore, what does “B2B” as a vertical truly encompass? Are we suggesting that, for instance, lead generation for architectural firms is so comparable to enterprise scheduling software for Boeing that a single, seemingly precise, benchmark can effectively represent both? And would selling SAAS to law firms fall under B2B or “legal”?
Conversely, you can’t simply “pick one and go with it”
Here’s a common yet equally frustrating argument from the other side…
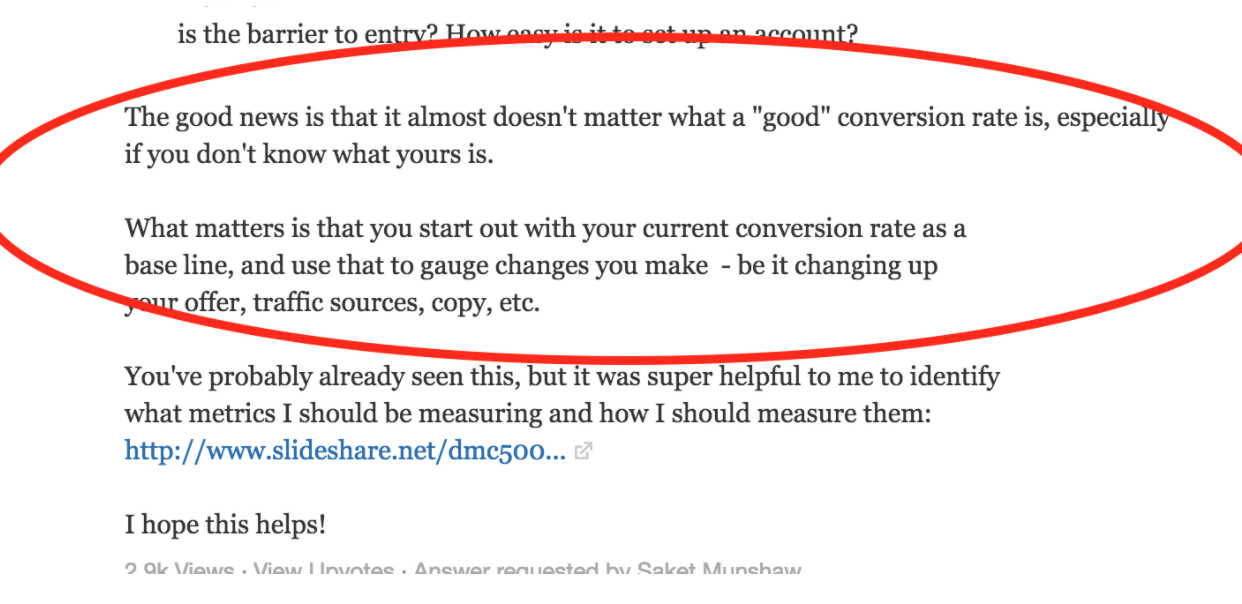
Are they suggesting that a good conversion rate is irrelevant? That you should just “pick one and strive to improve it”? This approach is flawed for two primary reasons: diminishing returns and opportunity cost. Diminishing returns illustrate the concept that, sometimes, a unit of effort yields a unit of reward, like accelerating a car from zero to 30 mph with minimal air resistance. However, in other scenarios, the same effort produces significantly fewer returns, like accelerating a car from 100 to 130 mph. This is because overcoming friction and wind resistance at higher speeds demands exponentially more energy. The same principle applies to your sales funnel. If your front page has a 1% opt-in rate, regardless of your industry, there’s substantial room for improvement with just a little effort in design and copywriting.
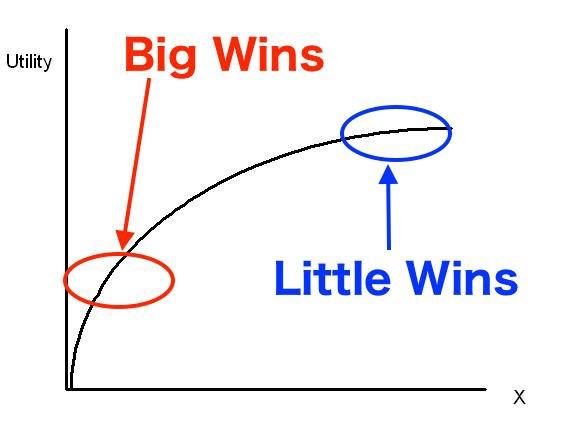
Conversely, if your webinar sales conversion rate is already at 25%, achieving each additional percentage point will require significant time and effort. Opportunity cost reminds us that, in reality, pursuing all strategies simultaneously is impossible due to finite time and resources. Every hour your team dedicates to one problem is an hour they can’t spend on something else. What if dedicating time and resources to improving one metric leads to neglecting another that could yield greater results? In essence: You need a system to determine whether small optimization efforts in a particular area of your funnel are likely to yield significant rewards, or vice versa.

To achieve this, let’s take a cue from Sir Thomas Bayes, known for Bayes’ Rule/Theorem. If you’re interested in the technical details, a quick Google search will provide ample information. For the purpose of this discussion, Bayes provided a framework for starting with an educated guess about a rate or probability and then refining it as real-world data becomes available. For instance, I know from Ramit Sethi that a reasonable universal benchmark for sales relative to the total number of people exposed to an offer is 1-2%. Knowing this can save you considerable effort if your list-to-sale rate is already 3%. (More on what to do in such a scenario later.) However, my experience with both my own business and those of my clients suggests this rate might be a bit low. Not an issue, Bayes would argue: you can start with these figures and adjust as you gather more real-world data. Below are some reasonable “educated guesses” for starting points, with the understanding that you’ll refine them based on the specific data from your business:
Conversion Rate Benchmarks: Opt-Ins vs. Sales
Are you aiming for email addresses or direct sales? If it’s the former, and your conversion rate is below 10%, you likely have room for improvement. Here are some examples:
- Homepage: Offering a free guide in exchange for an email address
- “Content upgrade”: Providing the specific tool used to achieve a discussed outcome in exchange for an email address
- Landing page: Inviting visitors to a free live video training to address a particular problem, requiring only an email address to sign up
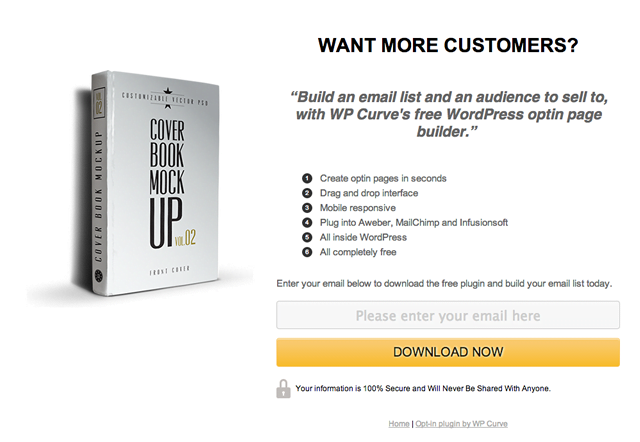
A typical email opt-in landing page However, if you’re offering something that isn’t free – like a paid product or service – Ramit Sethi would say a conversion rate between 1% and 2% is considered good. Examples of where this benchmark applies:
- Number of buyers from an email list segment that received a product launch announcement.
- Percentage of webinar registrants (not just attendees) who convert into paying customers, particularly for high-ticket services like consulting (even when a sales call is involved). Of course, numerous caveats exist: In practice, I’ve seen both well-crafted sales sequences/pages and webinars convert at much higher rates. Conversely, I’ve also witnessed highly-targeted copy failing to convert, especially with paid traffic. However, you can follow Bayes’ advice: start with the benchmark and adjust as needed based on the data you gather. Here are a few potential time-wasters these benchmarks can help you avoid:
- Excessively optimizing a landing page that’s already achieving a 15% opt-in rate.
- Rewriting a sales page that’s already converting at 3% relative to the list segment if your opt-in rate is only 3%.
Outliers like “Request a Quote”
Not all businesses prominently feature an email opt-in on their homepages. Some encourage visitors to “view pricing” or “request a quote.” (For some reason, these CTAs are particularly popular among web agencies.)
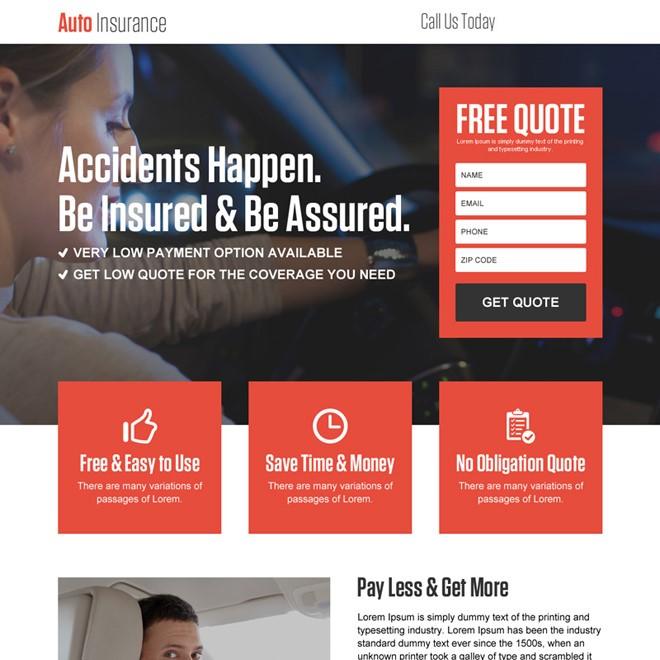
A typical “get a quote” landing page So, how do we assess the conversion rate of a “request a quote” CTA? Let’s explore the Straightforward Approach. Here’s what I mean… We’re familiar with the opt-in benchmark… …and we know the sales benchmark… Given that requesting a quote falls somewhere “in between” obtaining a free lead magnet/registering for a webinar and actually making a purchase, a logical starting point is “in between” those benchmarks. If less than 1% of visitors are requesting a quote, there’s likely an issue. If more than 10% are, I’m going to need a copy of your landing page immediately. If it falls somewhere in between, a more nuanced question arises…
What’s the customer acquisition cost associated with this approach, and is it lower than simply capturing an email address and selling to the list later?
Here’s what I frequently observe: “request a quote” CTAs that are either underperforming, are one of several competing CTAs (hedging bets by incorporating both a quote CTA and a lead magnet), or both.
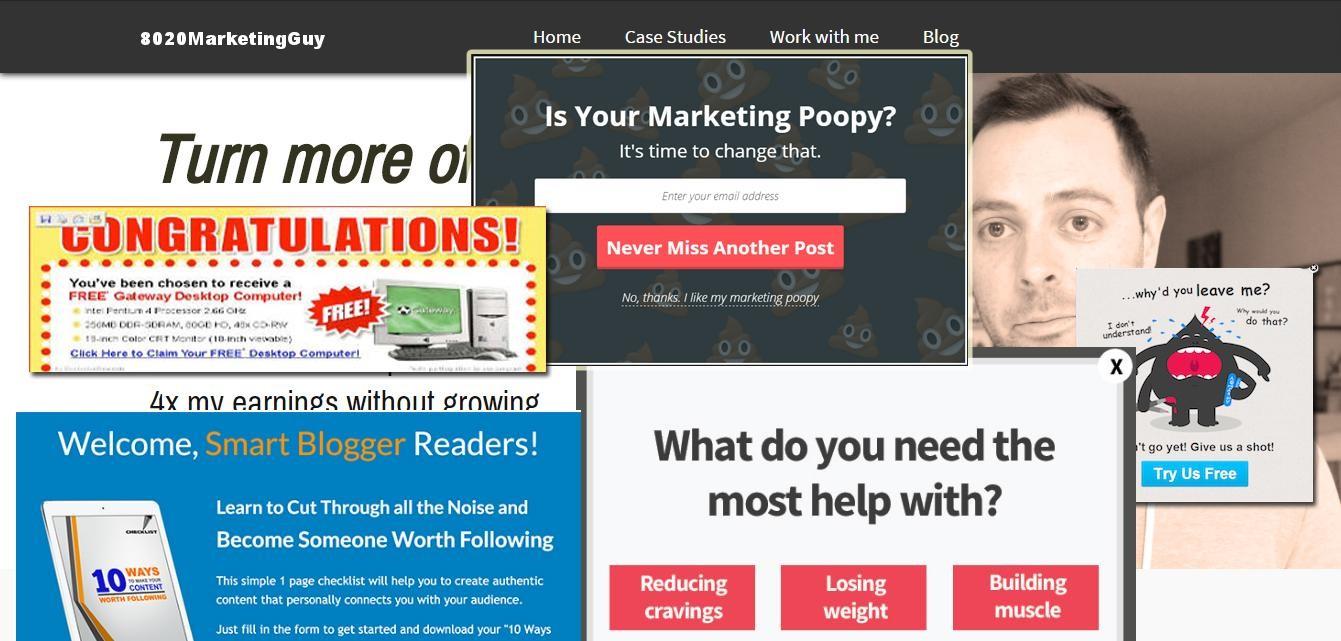
Does your page have too many CTAs? There’s a sophisticated and a straightforward approach to testing this: (To be clear, in this context, “straightforward” doesn’t equate to “bad” – it simply means “so obvious that even intelligent individuals might overlook it.”) Sophisticated: Split-test two pages, tagging those who opt-in to the list first differently from those who purchase directly after requesting a quote, then track the number of sales associated with each tag. Straightforward: Conduct a survey asking buyers, “Did you purchase directly from my homepage, or did you subscribe to my list first?” If a majority of buyers are originating from the list, and/or your “request a quote” rate is low, consider removing it altogether and focusing on email capture. You can always incorporate an upsell page inviting quote requests immediately after opt-in. Even if a significant portion of visitors are requesting quotes directly, why not implement both approaches?
- Integrate the email capture within the quote request process by making the first question, “To receive your personalized assessment, please provide your best email address,” and require a click to the next page after submission.
- Consider using a subtle exit pop-up (one of the few instances where I recommend this, as I believe they’re often overused and can harm brand perception). If most potential buyers are already requesting quotes, there’s minimal downside to presenting a lower-commitment offer to those who don’t – you can always market to them later via email.
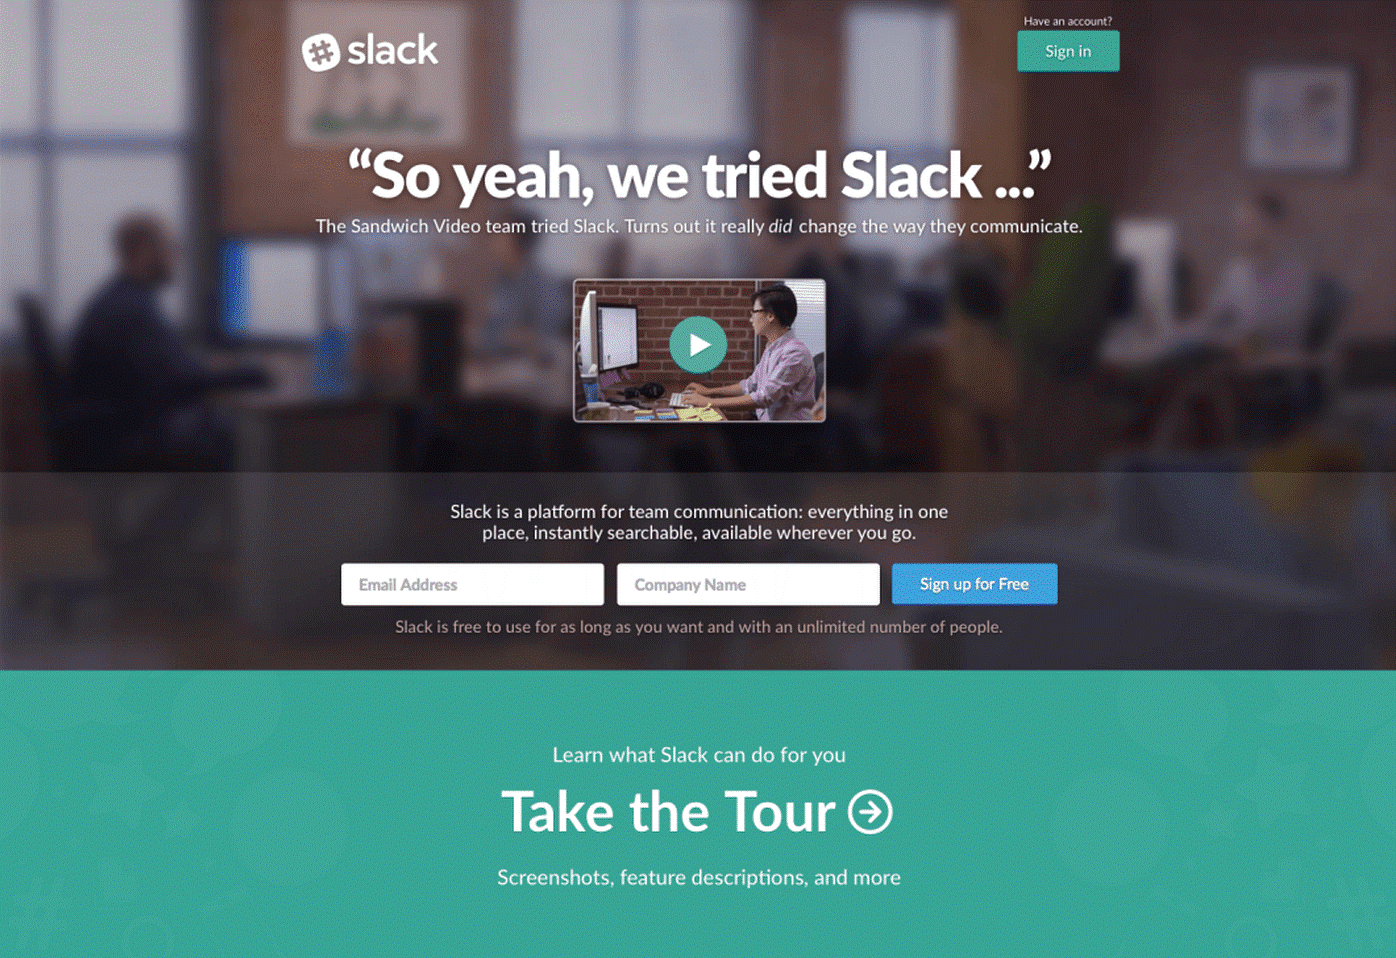
Slack’s effective landing pages present visitors with a single clear call to action above the fold Here are a few more time-wasters that understanding this framework can help you avoid:
- Wasting months split-testing “request a quote” offers that aren’t even driving the majority of sales while missing the opportunity to capture thousands of potential buyer email addresses.
- Expending resources trying to optimize a “request a quote” CTA that’s already performing well (e.g., at 7% or 8%), instead of considering it “good enough” and moving on.
Putting It into Practice
Consider this thought experiment I often use in my presentations: imagine your business is indebted to the mob, and you have just 30 days to double your profits. Payments must be made in installments, no lump sum allowed. (Nice try, I see what you’re attempting…) Essentially, you need to double your MRR, or monthly recurring revenue. This eliminates one-time sales, launches, or risky joint ventures. Fortunately, conversion optimization can deliver 1.5x or greater improvements within the time it takes to craft copy and run a split test. Achieve a few wins of that magnitude, and concealing the extra cash from the mob might become your biggest concern. In such a scenario, here’s a possible decision tree to follow…
What’s my list-to-sale rate?

Know what to check in your funnel As mentioned before, this simply means “what percentage of individuals exposed to an offer end up making a purchase?” Broadly speaking, this examines whether your funnel effectively converts leads into customers. Below 1%? Your sales pages, webinars, and email sequences could likely benefit from improved copywriting and strategic positioning. (This assumes your product-market fit is solid, but that’s a topic for another time…) Action: Note the current rate. How far below 2% is it? How significant would an improvement to 2% be? Above 2%? This might not be the area with the highest potential for improvement. Action: Move on to another metric.
What’s my opt-in rate?
This metric, as explained before, represents the proportion of site visitors who subscribe to your email list. Below 10%? Your homepage, landing pages, and most popular content might benefit from enhanced copywriting and design. (If you’re not already using one of Sumome’s tools, you should be.) Action: Make a note of it. What kind of marginal gain could you achieve by pushing this rate above 10%? Above 10%? This is probably not the area that will yield the most significant gains. Action: Move on to another area for optimization.
What if both rates exceed benchmarks?
There are three possibilities:
- Your system is highly optimized, and it’s time to consider raising prices. If your list-to-sale rate exceeds 4% or 5% (or 20% from a webinar, relative to attendees), a price increase might be warranted. If rates subsequently drop below benchmarks, you can leverage copywriting and design to bring them back up, knowing you’re focusing on the right metrics.
- Your system is highly optimized, and traffic generation is the next logical step. In some cases, increasing traffic is the most effective way to drive growth.
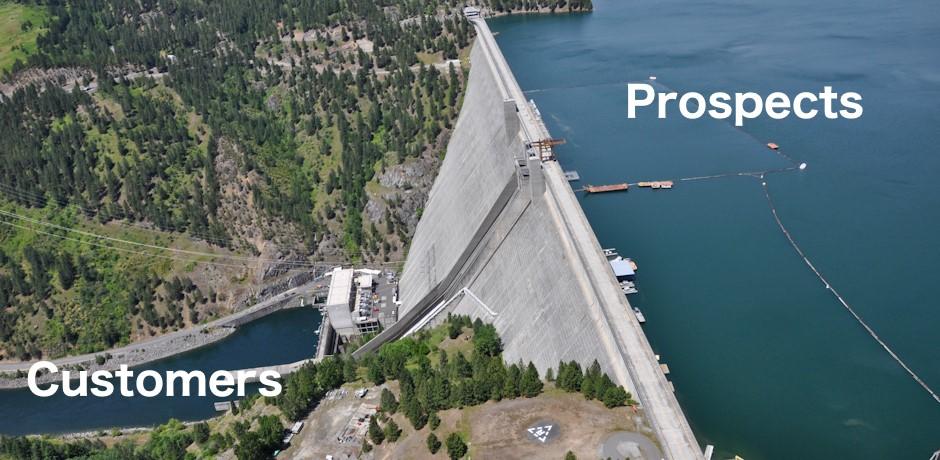
- You might be over-segmenting or introducing unnecessary steps in your funnel, thereby needlessly reducing the number of people who encounter an offer. If the third possibility resonates, ask yourself: “How many ‘segmentation points’ (instances where customers must take action to proceed) am I requiring before presenting an offer? Could this number be reduced?”

How many bottlenecks are you requiring your customers to pass through? (For a deeper dive, refer to this post) There you have it: I’ve illustrated the drawbacks of both overly specific and nonexistent benchmarks when aiming to boost sales through conversion optimization. The solution? Not necessarily “smarter” benchmarks, but rather more straightforward ones, coupled with a strategic approach to learning from them.