I recently started a cryptocurrency analysis platform, anticipating a small daily user base. But, when several prominent YouTubers discovered and endorsed the site, the surge in traffic overwhelmed my server, causing downtime for my platform, Scalper.AI](http://scalper.ai). My existing AWS [EC2 setup needed bolstering. After exploring different options, I opted for AWS Elastic Beanstalk to scale my application. While everything seemed to be running smoothly, I was caught off guard by the costs reflected in my billing dashboard.
This is a common experience. A survey from 2021 revealed that 82% of IT and cloud decision-makers have faced unexpected cloud expenses, with 86% feeling unable to gain a complete picture of their cloud spending. While Amazon offers comprehensive documentation on their pricing, the model can feel intricate for a scaling project. To simplify things, I’ll explain some relevant optimizations for reducing your cloud expenses.
My Rationale for AWS
Scalper.AI aims to collect data on cryptocurrency trading pairs, perform statistical analysis, and provide insights to crypto traders about the market’s status. Technically, the platform comprises three components:
- Data collection scripts
- A web server
- A database
The scripts gather data from various sources and populate the database. Having prior experience with AWS, I decided to deploy these scripts on EC2 instances. EC2 provides a variety of instance types, allowing you to customize the processor, storage, network, and operating system.
I chose Elastic Beanstalk for its streamlined application management capabilities. Its load balancer efficiently distributed the workload across my server instances, while autoscaling dynamically adjusted for traffic fluctuations. Deploying updates was a breeze, taking mere minutes.
Scalper.AI stabilized, and downtime became a non-issue for my users. Naturally, I anticipated an increase in costs due to the additional services, but the actual figures significantly exceeded my projections.
Potential Cost Reduction Strategies
Reflecting on my experience, I recognize areas where my project’s AWS usage could have been optimized. Let’s delve into the budget-friendly improvements I discovered while working with common AWS EC2 features: burstable performance instances, outbound data transfers, elastic IP addresses, and the distinction between terminating and stopping instances.
Leveraging Burstable Performance Instances
My initial hurdle involved managing CPU consumption as my project expanded. Scalper.AI’s data ingestion scripts, designed to deliver real-time analysis, ran every few seconds, constantly updating the platform with the latest data from cryptocurrency exchanges. Each cycle generated a large volume of asynchronous jobs, so the increased traffic demanded more CPU power to expedite processing.
The most affordable AWS instance with four vCPUs, a1.xlarge, was priced at approximately $75 per month at the time. To optimize costs, I decided to distribute the load across two t3.micro instances, each equipped with two vCPUs and 1GB of RAM. These t3.micro instances offered sufficient speed and memory for my needs at a fifth of the a1.xlarge’s cost. Despite this, my monthly bill remained higher than expected.
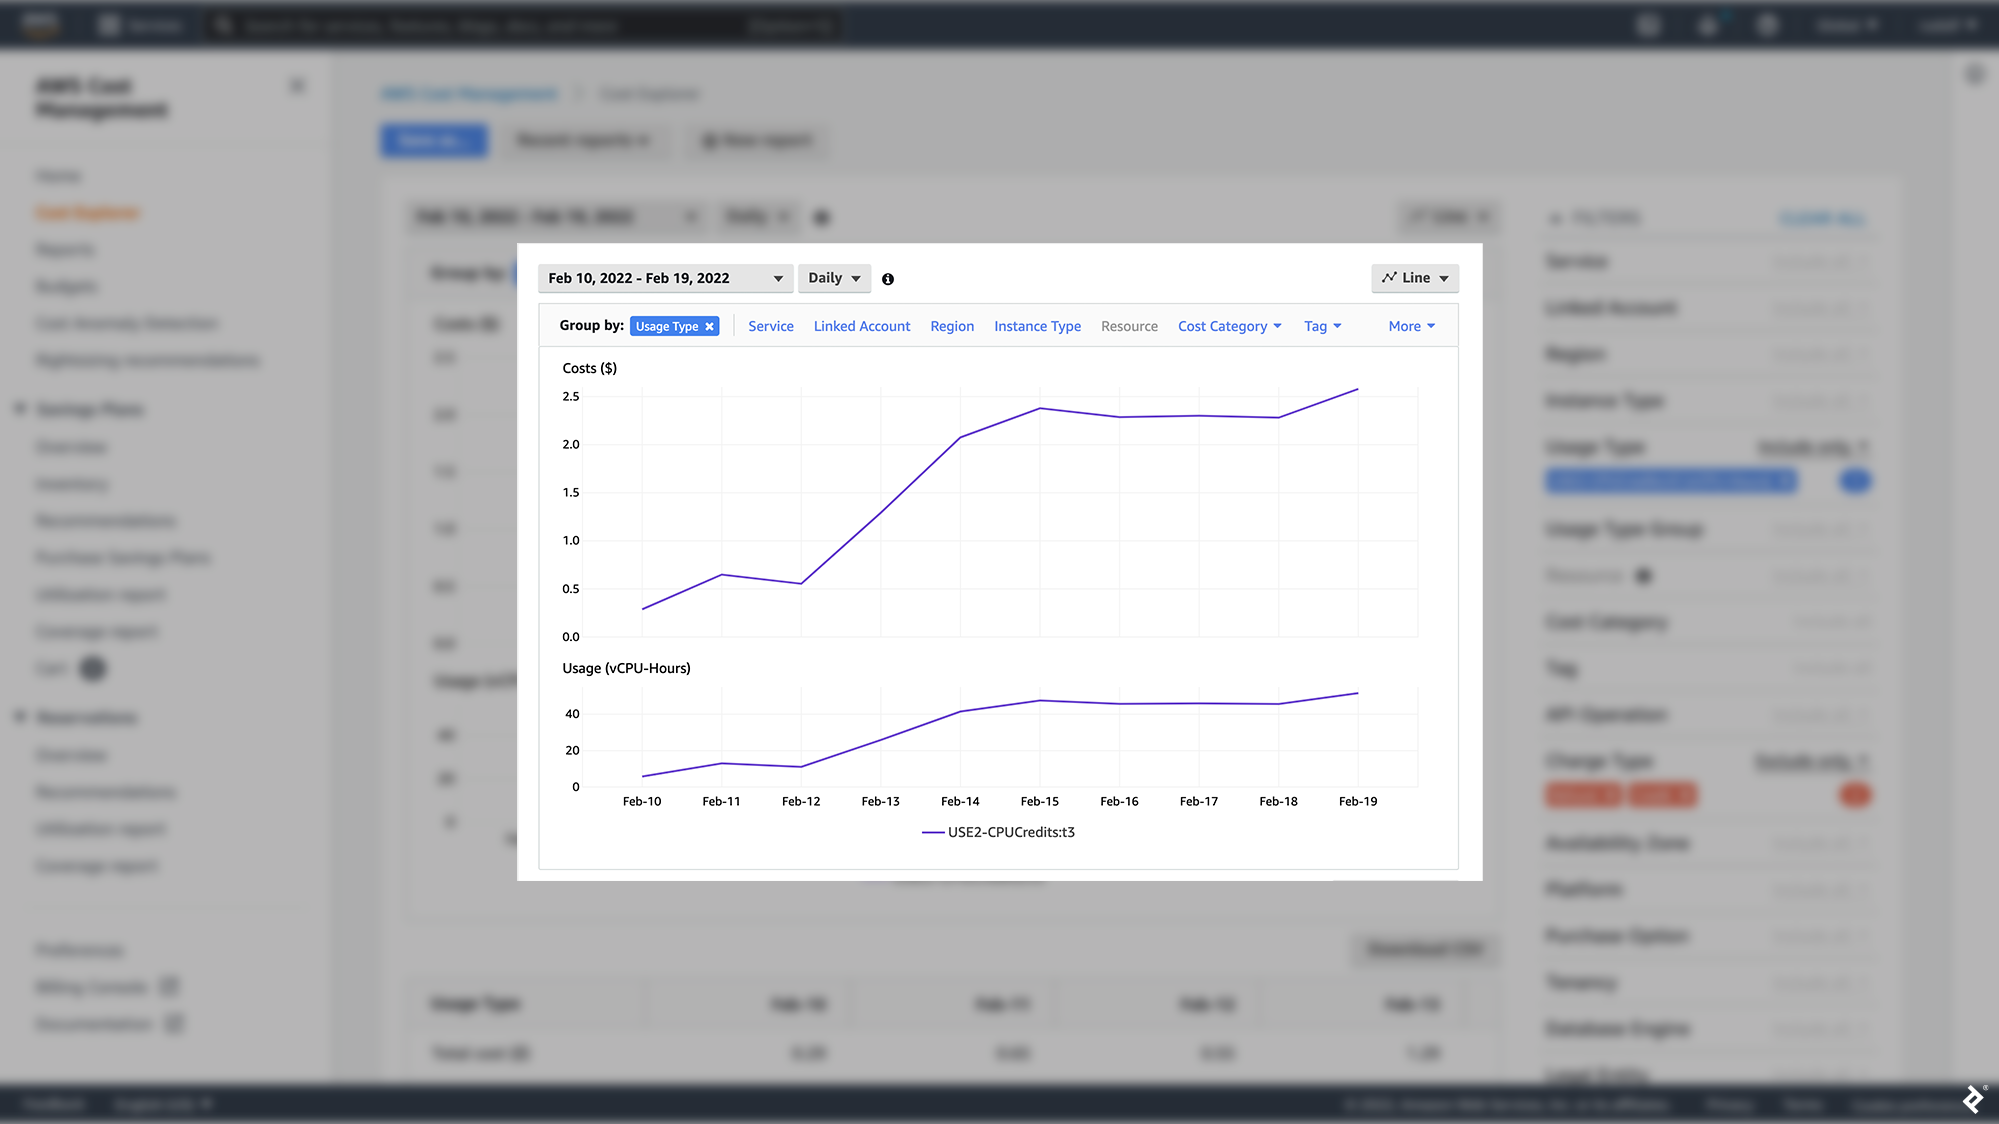
To understand why, I turned to Amazon’s documentation. It explained that when an instance’s CPU usage falls below a predetermined baseline, it accrues credits. Conversely, when usage exceeds this baseline, the instance consumes these credits. If no credits are available, the instance utilizes “surplus credits” provided by Amazon. This credit system allows Amazon EC2 to calculate an instance’s average CPU usage over a 24-hour period. If the average surpasses the baseline, the instance incurs additional charges at a fixed rate per vCPU-hour.
Monitoring the data ingestion instances for several days revealed a critical oversight: My CPU configuration, intended to reduce costs, was actually increasing them. My average CPU usage consistently exceeded the baseline.

Initially, I analyzed CPU usage based on a limited set of crypto pairs, resulting in a low load that misled me into thinking I had ample room for growth. (I only needed one micro-instance for data ingestion as fewer pairs required less CPU power.) However, I failed to consider the limitations of my initial assessment when I expanded my analysis to encompass hundreds of pairs—cloud service analysis is only meaningful when conducted at the appropriate scale.
Optimizing Outbound Data Transfers
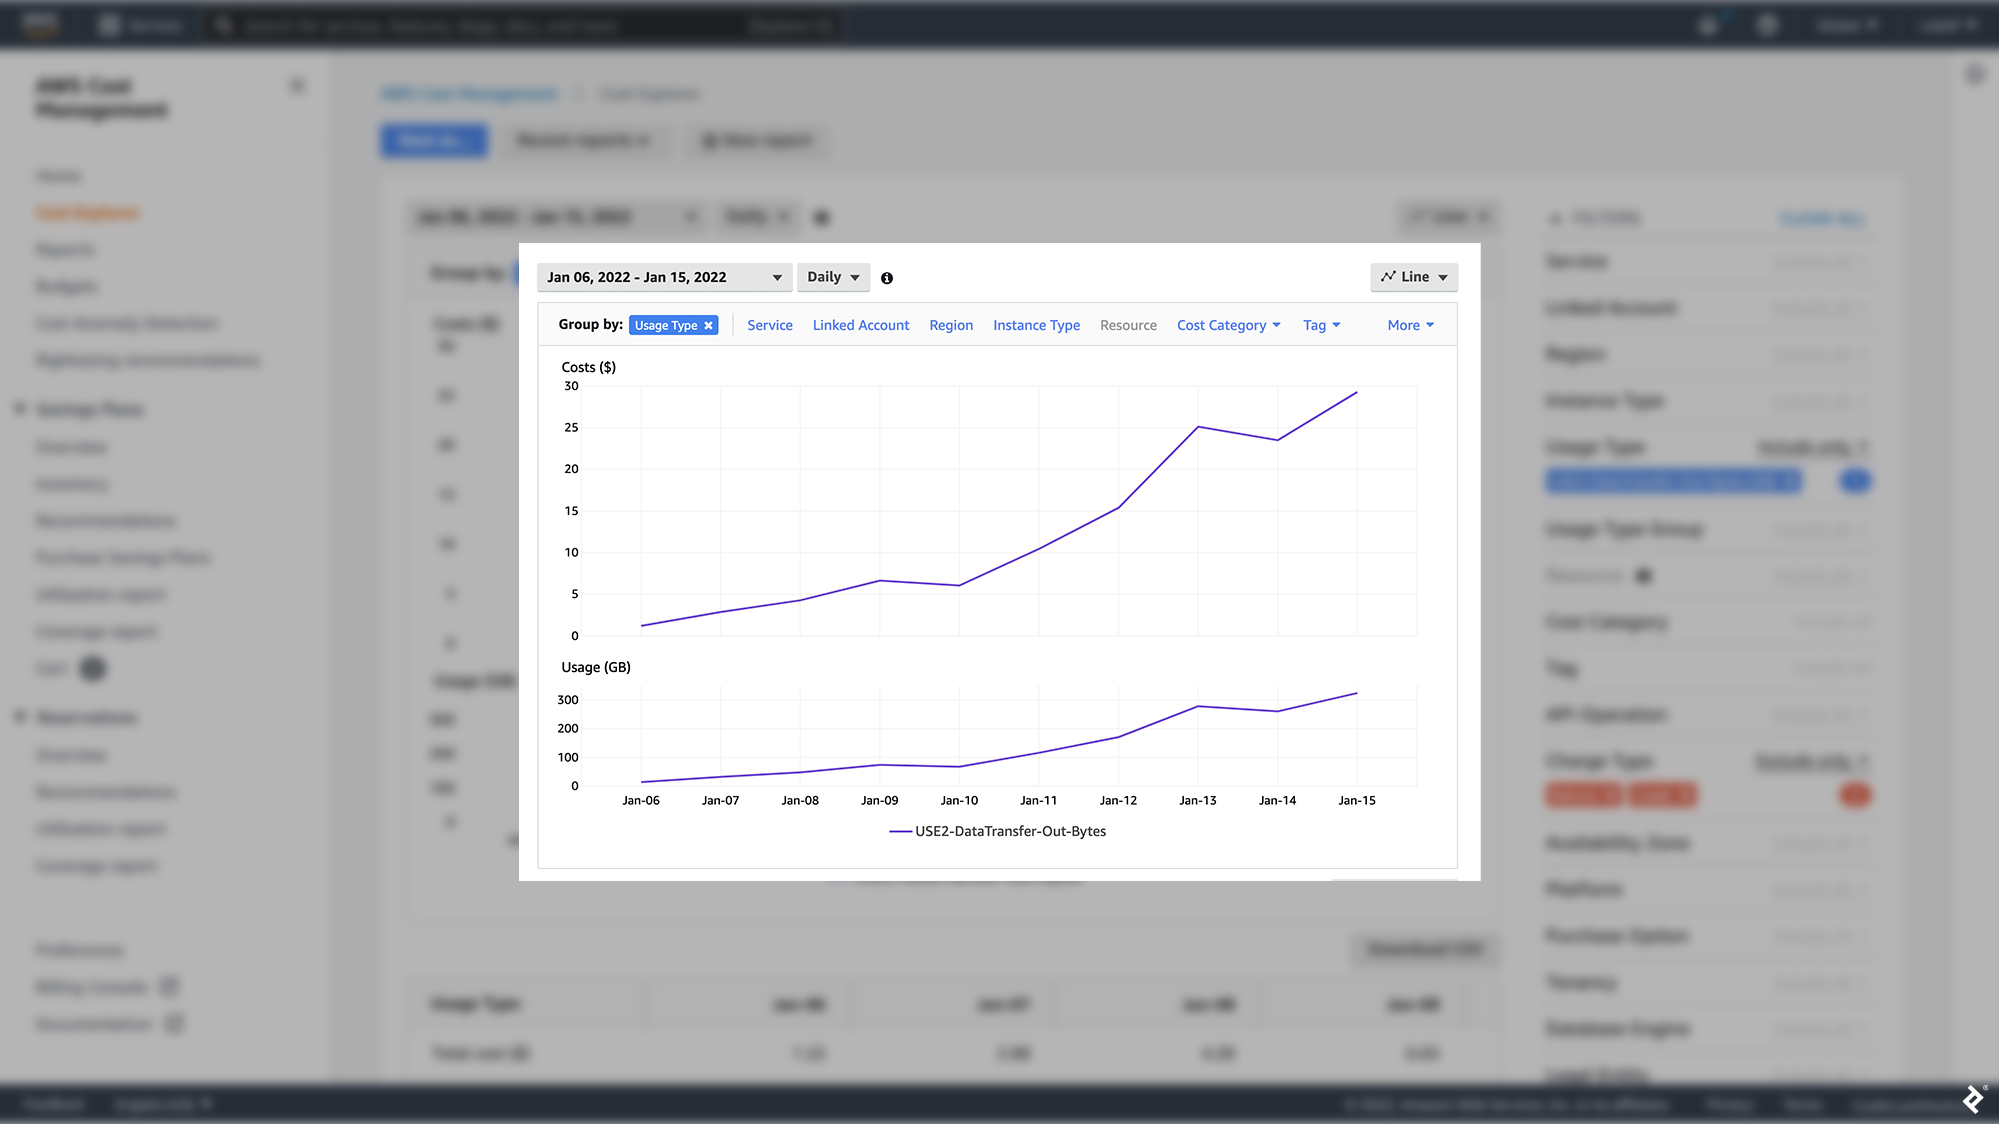
Another consequence of my site’s growth was a surge in data transfers due to a minor coding error. With traffic steadily increasing and downtime resolved, I was eager to implement features to engage users. My latest addition was an audio alert system, notifying users when a crypto pair’s market behavior matched their preset criteria. Unfortunately, a bug in my code caused the audio files to reload in the user’s browser hundreds of times every few seconds.
The impact was significant. The continuous audio downloads from my web servers due to the bug resulted in a massive increase in outbound data transfers, causing my bill to balloon to nearly five times its previous amount. (The repercussions extended beyond just costs: This bug could potentially lead to memory leaks on the user’s end, prompting many users to abandon the platform.)

Data transfer costs can account for a substantial portion, upward of 30%, of unexpected increases in AWS expenses. While EC2 inbound data transfer is free, outbound transfers are billed per gigabyte ($0.09 per GB at the time of building Scalper.AI). As I learned firsthand, it’s crucial to be mindful of code that affects outbound data; minimizing downloads or unnecessary file loading (or closely monitoring these activities) is essential to avoid inflated charges. These seemingly insignificant costs can quickly accumulate as EC2 to internet data transfer charges are based on both workload and region-specific AWS rates. Additionally, a factor many new AWS users are unaware of is that data transfer between different geographic locations is more expensive. However, utilizing private IP addresses can help circumvent extra data transfer costs between various availability zones within the same region.
Efficient Use of Elastic IP Addresses
Even when utilizing public addresses such as Elastic IP addresses (EIPs), there are ways to minimize your EC2 expenses. EIPs are static IPv4 addresses designed for dynamic cloud environments. The “elastic” characteristic signifies that you can associate an EIP with any EC2 instance and utilize it until you choose to release it. These addresses facilitate seamless instance replacement by allowing you to remap the address from an unhealthy instance to a healthy one within your account. Additionally, EIPs can be used to configure a DNS record for a domain, directing it to a specific EC2 instance.
AWS provides a limited allocation of five EIPs per account per region, making them a finite and potentially costly resource if used inefficiently. AWS charges a small hourly fee for each additional EIP and applies extra charges if an EIP is remapped over 100 times within a month; staying below these limits can contribute to cost savings.
Understanding Terminate and Stop States
AWS offers two options for managing the state of active EC2 instances: terminate or stop. Termination shuts down the instance, and the allocated virtual machine becomes irrecoverable. Any attached Elastic Block Store (EBS) volumes are detached and deleted, resulting in the loss of all locally stored data on the instance. You are no longer billed for the instance.
Stopping an instance is similar, but with a key difference: The attached EBS volumes are retained, preserving their data, and allowing you to restart the instance later. In both scenarios, Amazon ceases charging for the instance. However, opting to stop instead of terminate means you will continue to incur charges for the EBS volumes as long as they persist. AWS advises stopping an instance only if you plan to reactivate it soon.
However, there’s a feature that can unexpectedly inflate your AWS bill even if you terminated an instance instead of stopping it: EBS snapshots. Snapshots are incremental backups of your EBS volumes stored in Amazon’s Simple Storage Service (S3). Each snapshot contains the necessary information to create a new EBS volume with your previous data. When you terminate an instance, its associated EBS volumes are automatically deleted, but their snapshots are retained. Since S3 charges based on the amount of data stored, I recommend that you delete these snapshots any snapshots that won’t be needed in the near future. AWS allows you to monitor the storage activity of individual volumes using the CloudWatch service:
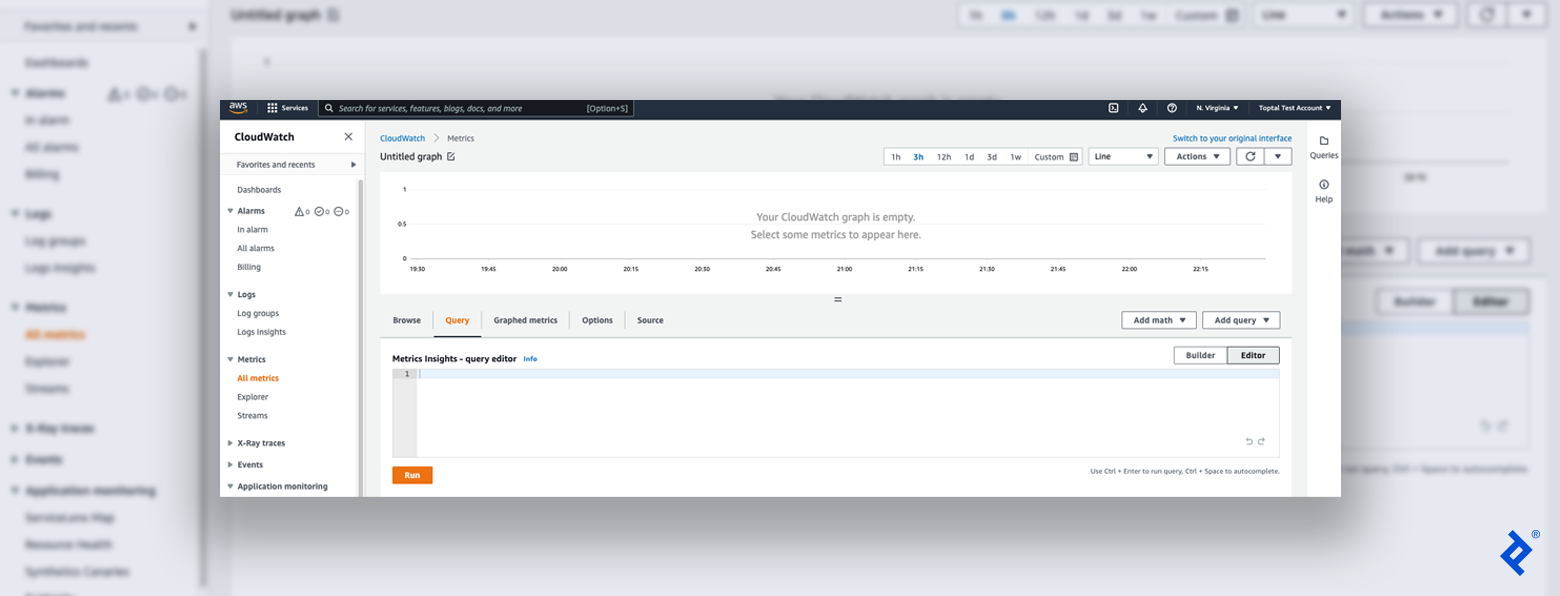
- Log in to the AWS Console and navigate to the CloudWatch service from the Services menu in the top-left corner.
- On the left side of the page, under the Metrics collapsible menu, select All Metrics.
- You’ll see a list of services with available metrics, including EBS, EC2, S3, and more. Click on EBS and then Per-volume Metrics. (Note: The EBS option will only be visible if you have EBS volumes configured in your account.)
- Go to the Query tab. In the Editor view, paste the following command:
SELECT AVG(VolumeReadBytes) FROM "AWS/EBS" GROUP BY VolumeId, and then click Run. (Note: CloudWatch utilizes a SQL dialect with a specific unique syntax.)

CloudWatch offers a range of visualization formats to analyze storage activity, including pie charts, line graphs, bar charts, stacked area charts, and numerical displays. Utilizing CloudWatch to pinpoint inactive EBS volumes and snapshots is a simple yet effective way to optimize your cloud expenditure.
Keeping More Money in Your Pocket
While AWS tools like CloudWatch offer robust cloud cost monitoring solutions, numerous external platforms integrate with AWS for a more comprehensive analysis. For instance, cloud management platforms such as VMWare’s CloudHealth provide a detailed breakdown of your top spending areas, facilitating trend analysis, anomaly detection, and cost and performance monitoring. Additionally, I recommend setting up a CloudWatch billing alarm to proactively detect any unusual spikes in your bill before they escalate.
Amazon offers a plethora of exceptional cloud services that can alleviate the burden of server, database, and hardware maintenance by entrusting it to the AWS team. While cloud platform costs can easily escalate due to coding errors or user oversights, AWS monitoring tools empower developers with the knowledge to mitigate unnecessary expenses.
By implementing these cost optimization strategies, you’re well-equipped to launch your project and potentially save hundreds of dollars in the process.
