People who enjoy watching movies often rely on rankings to help them decide what to watch. While doing this myself recently, I realized that a large number of highly ranked films fell into the drama genre. This observation led me to believe that the ranking system might be biased towards certain genres.
I was browsing IMDb, one of the most popular websites for movie enthusiasts, which features movies from different countries and time periods. Its renowned ranking system is based on an extensive collection of user reviews. To investigate this further, I decided to download the complete dataset from IMDb and analyze it to see if I could develop a refined ranking system that took into account a wider range of factors.
The IMDb Rating System: Examining the Data
I was able to obtain data on 242,528 movies released between 1970 and 2019. For each movie, IMDb provided the following information: Rank, Title, ID, Year, Certificate, Rating, Votes, Metascore, Synopsis, Runtime, Genre, Gross, and SearchYear.
To ensure I had sufficient data for analysis, I set a minimum threshold of 500 reviews per movie. This filtering process resulted in a dataset of 33,296 movies. The table below presents a summary analysis of the fields in this reduced dataset:
| Field | Type | Null Count | Mean | Median |
|---|---|---|---|---|
| Rank | Factor | 0 | ||
| Title | Factor | 0 | ||
| ID | Factor | 0 | ||
| Year | Int | 0 | 2003 | 2006 |
| Certificate | Factor | 17587 | ||
| Rating | Int | 0 | 6.1 | 6.3 |
| Votes | Int | 0 | 21040 | 2017 |
| Metascore | Int | 22350 | 55.3 | 56 |
| Synopsis | Factor | 0 | ||
| Runtime | Int | 132 | 104.9 | 100 |
| Genre | Factor | 0 | ||
| Gross | Factor | 21415 | ||
| SearchYear | Int | 0 | 2003 | 2006 |
Note: In the R programming language, Factor is used to represent strings. Rank and Gross appear as factors in the original IMDb dataset due to the presence of thousands separators.
Before I could begin refining the movie scores, I needed to further examine the dataset. The fields Certificate, Metascore, and Gross had a significant number of missing values (over 50%), making them unsuitable for analysis. Rank is directly dependent on Rating (the variable I aimed to refine), and therefore provided no additional insights. Similarly, ID served as a unique identifier for each film and was not relevant for this analysis.
The fields Title and Synopsis contained short textual descriptions. While it would be possible to analyze them using natural language processing (NLP) techniques, the limited amount of text led me to exclude them from this particular analysis.
After this initial filtering step, I was left with the following fields: Genre, Rating, Year, Votes, SearchYear, and Runtime. The Genre field often included multiple genres per movie, separated by commas. To account for the combined effect of multiple genres, I transformed the Genre field using one-hot encoding. This transformation generated 22 new boolean fields, one for each genre, with a value of 1 indicating the presence of that genre in a movie and 0 otherwise.
Analyzing the IMDb Data
To understand the relationships between the variables, I calculated the correlation matrix.
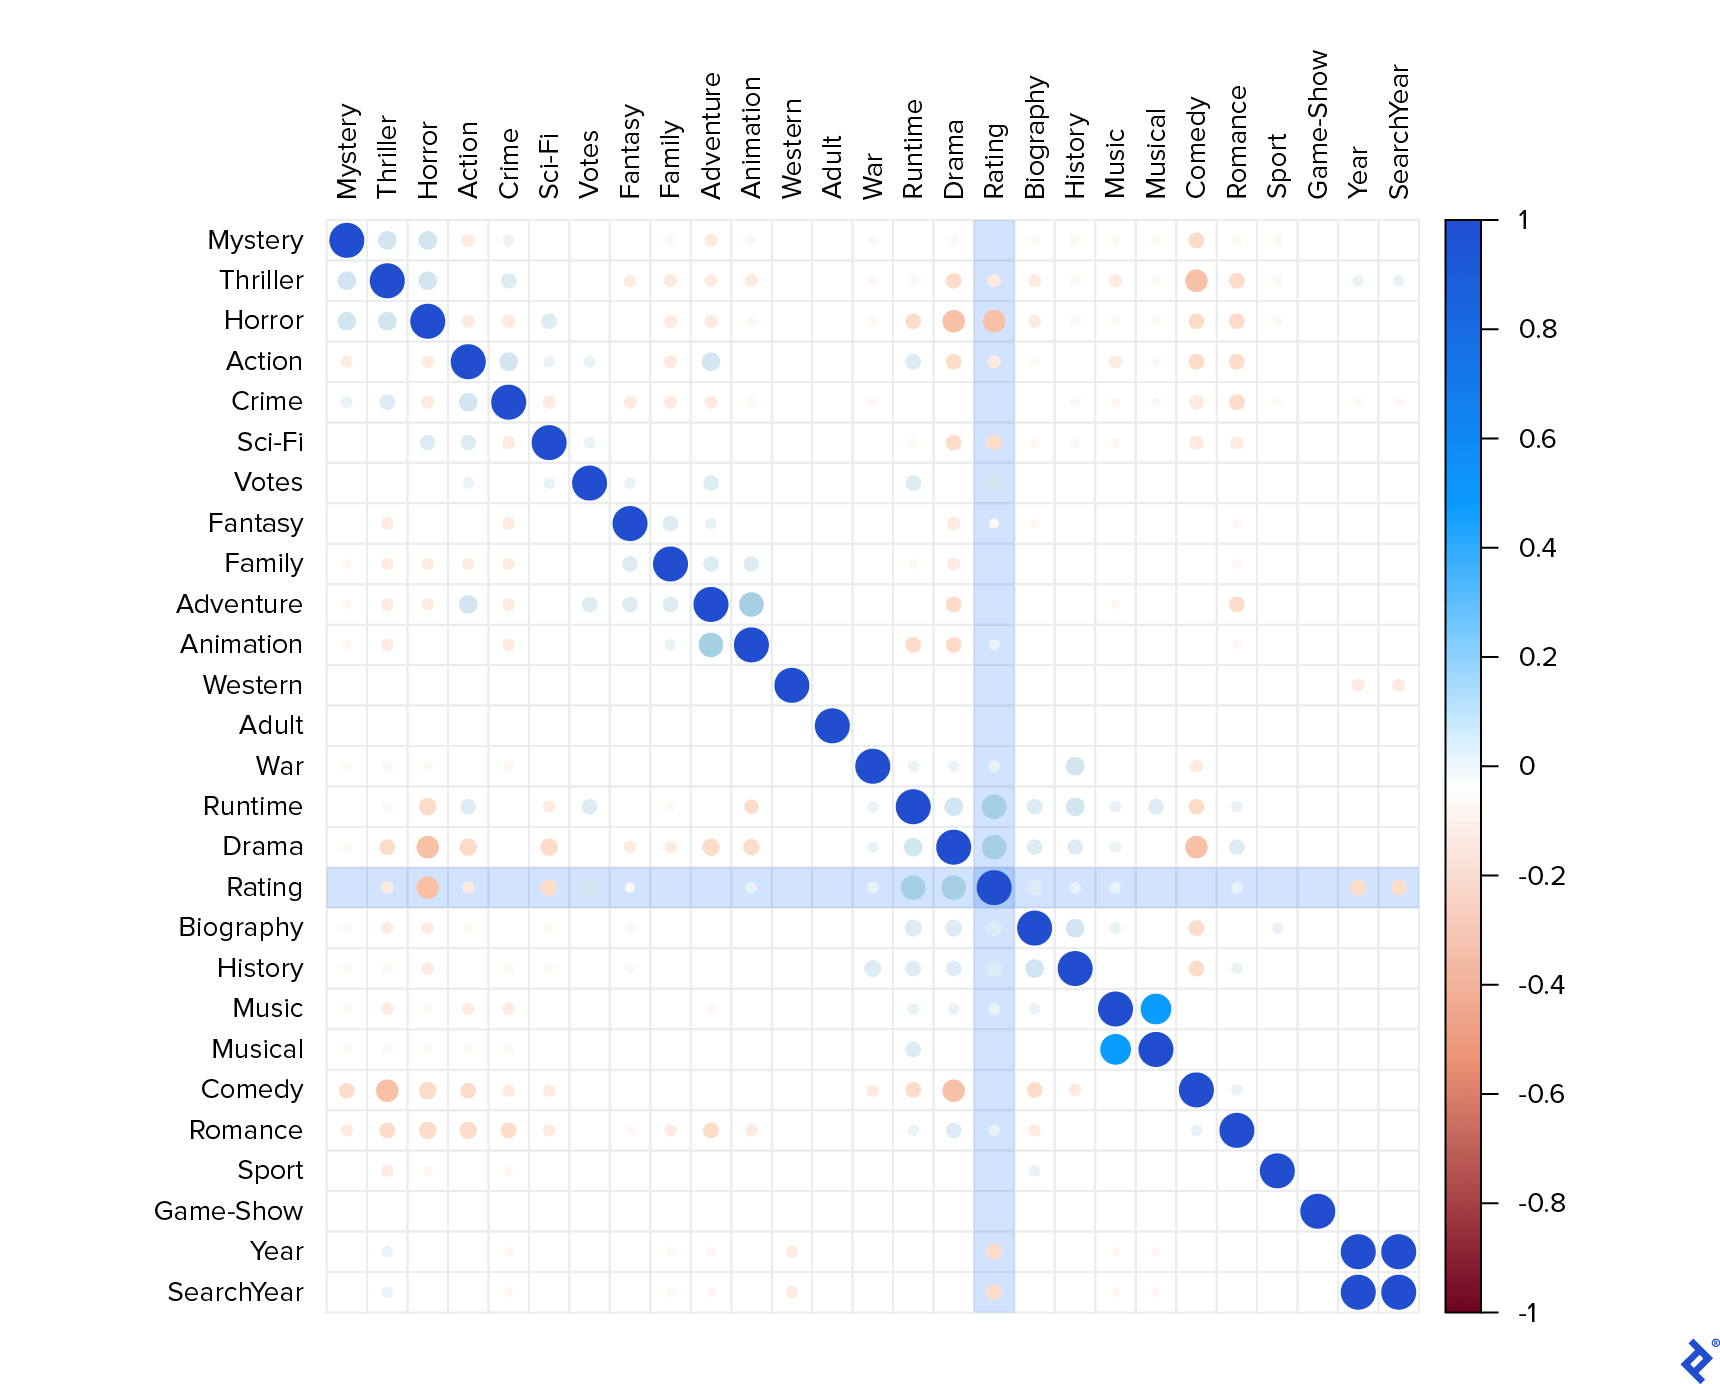
In this correlation matrix, a value close to 1 represents a strong positive correlation, while a value close to -1 indicates a strong negative correlation. The matrix revealed several interesting observations:
YearandSearchYearexhibited perfect correlation, suggesting they essentially carry the same information. Therefore, I decided to retain only theYearfield.- Some fields displayed expected positive correlations, such as:
MusicwithMusicalActionwithAdventureAnimationwithAdventure
- Similarly, some fields showed expected negative correlations:
Dramavs.HorrorComedyvs.HorrorHorrorvs.Romance
- Examining the correlations with the target variable (
Rating), I observed:- Significant positive correlations with
RuntimeandDrama. - Weaker correlations with
Votes,Biography, andHistory. - A substantial negative correlation with
Horrorand weaker negative correlations withThriller,Action,Sci-Fi, andYear. - No other noteworthy correlations.
- Significant positive correlations with
These observations indicated that lengthy dramas tended to receive higher ratings, while shorter horror movies received lower ratings. Although I lacked the data to confirm this, I suspected that these correlations did not necessarily reflect the types of movies that typically generate the highest profits, such as those produced by Marvel or Pixar.
It’s possible that the user base who vote on IMDb might not be representative of the general movie-going audience. Users who take the time to rate movies on the website are likely more passionate about film and may have more refined cinematic preferences. My goal, however, was to minimize the influence of these common movie characteristics and develop a more balanced rating system.
Genre Distribution in the IMDb Rating System
Next, I wanted to investigate the distribution of each genre across different rating levels. To do this, I created a new field called Principal_Genre based on the first genre listed in the original Genre field. I visualized this relationship using a violin graph.
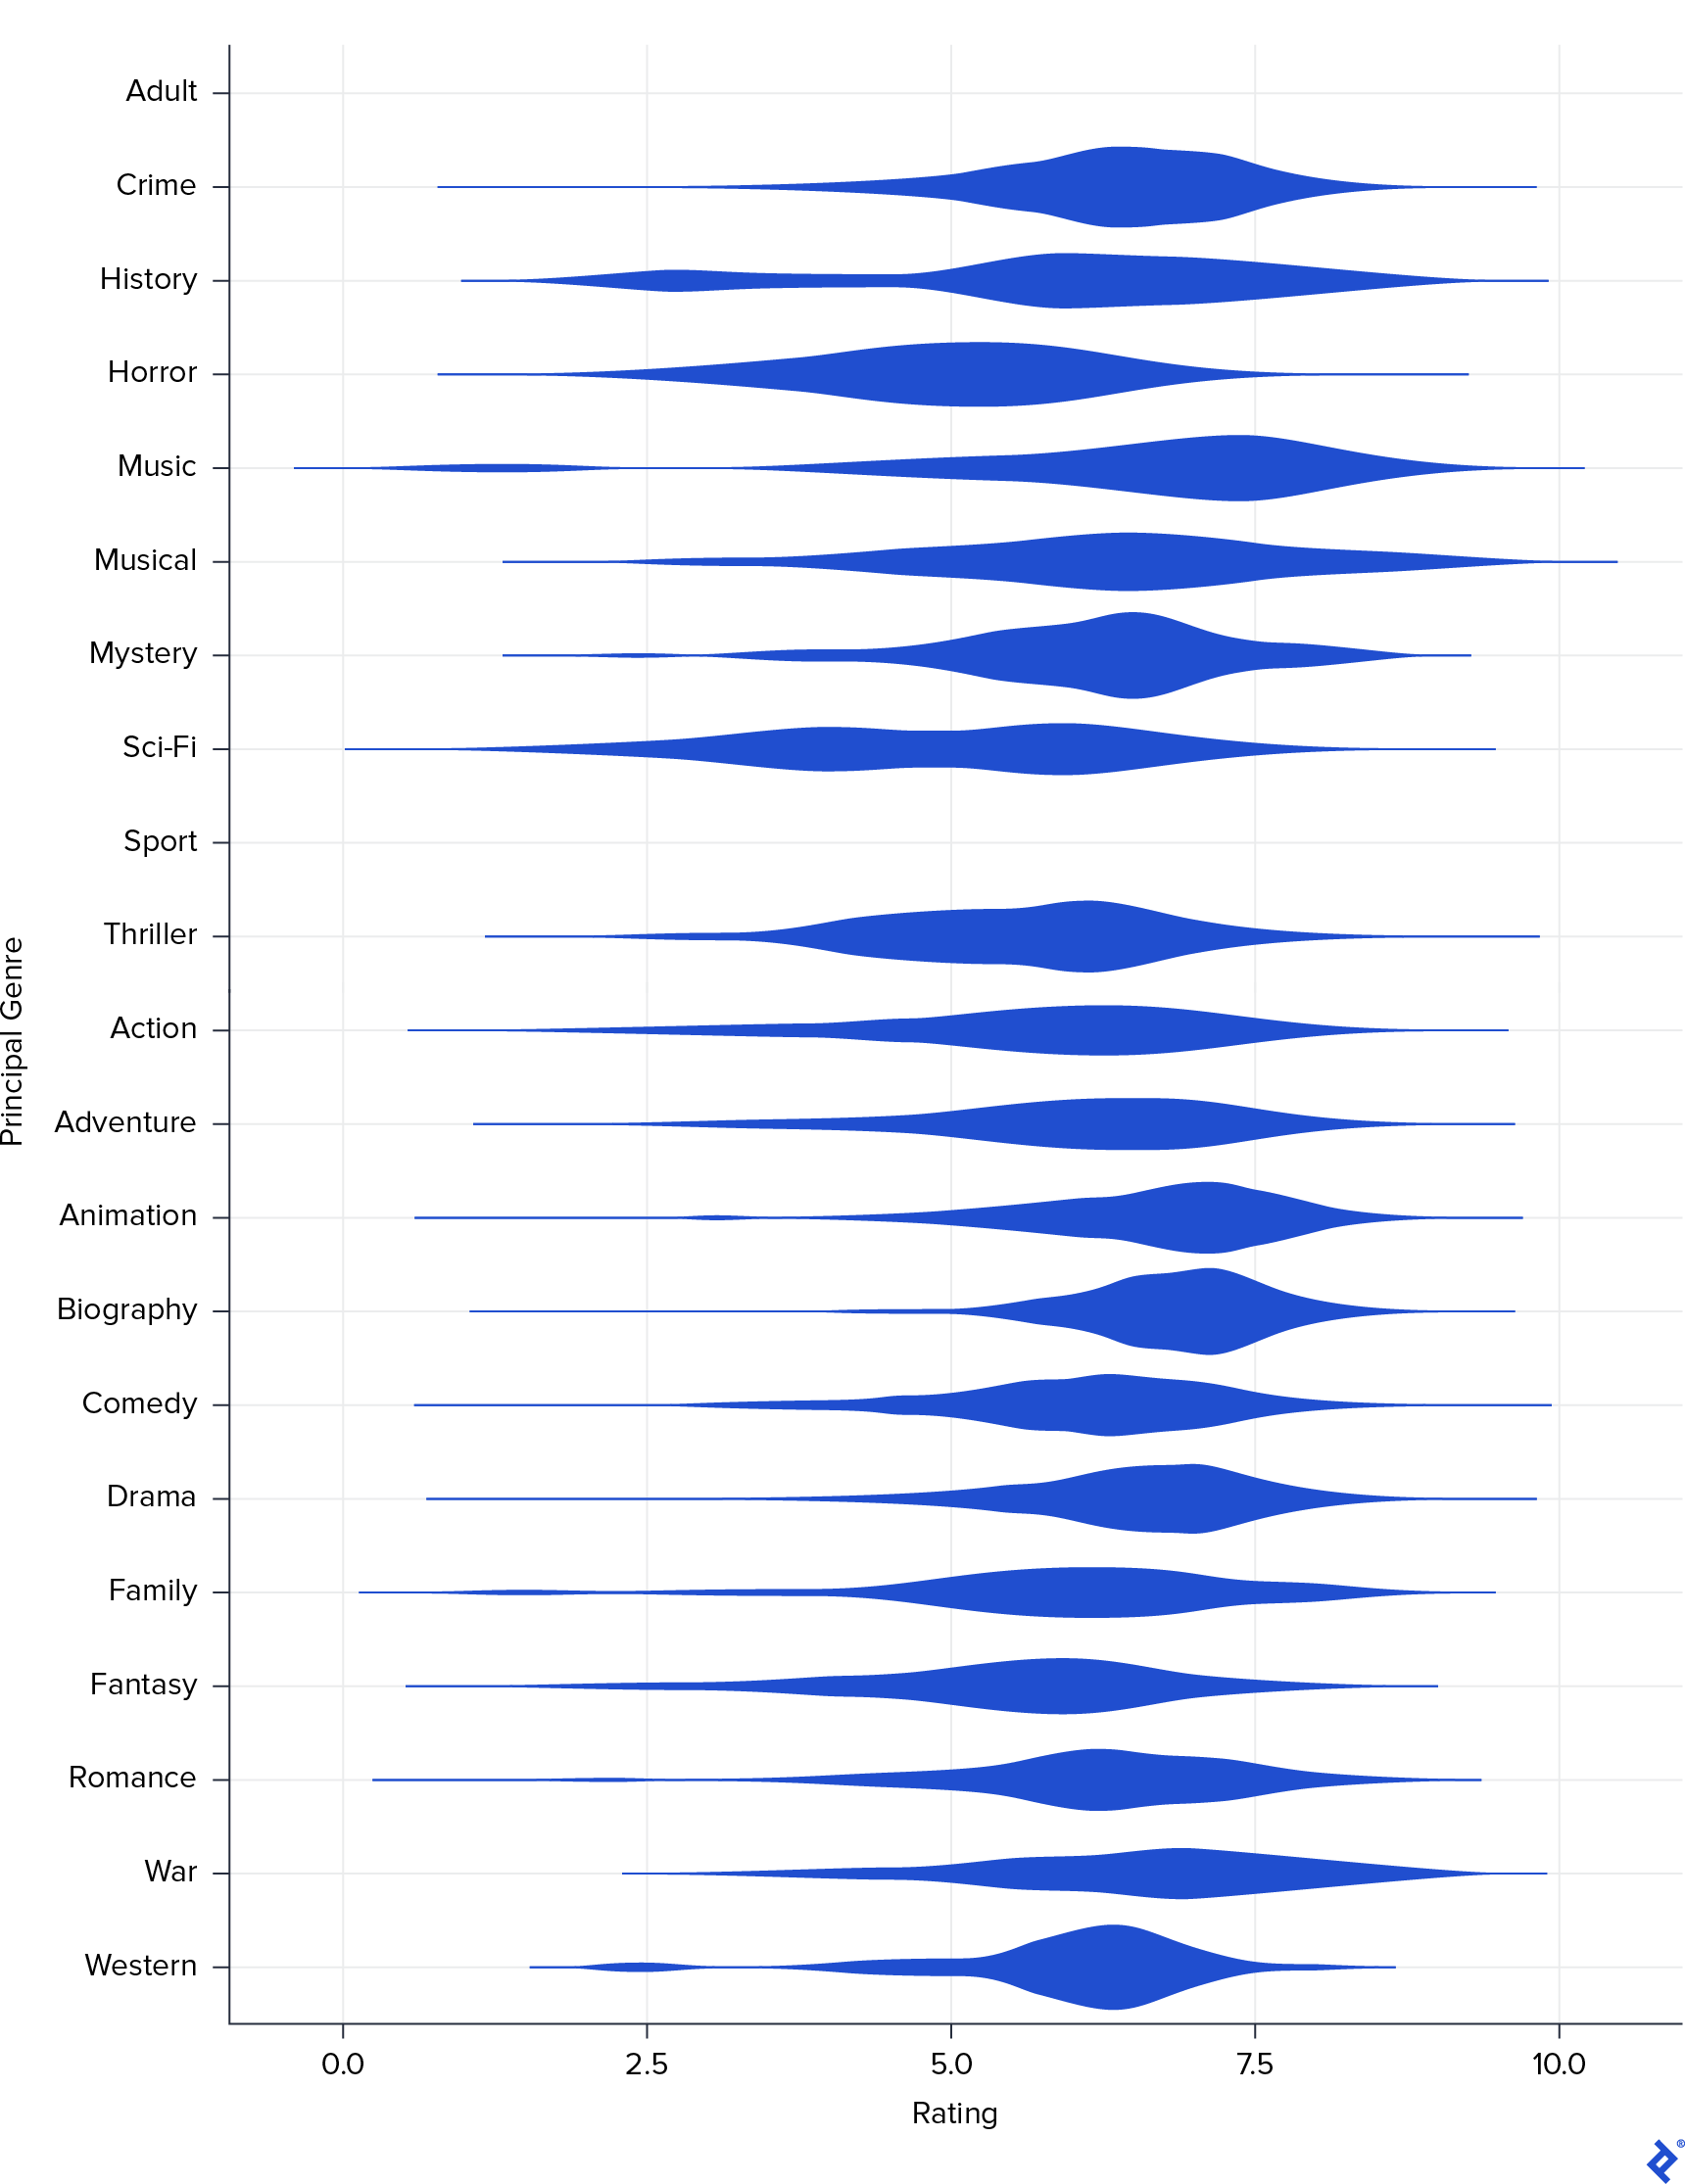
This visualization reinforced the previous finding that Drama tends to be associated with higher ratings and Horror with lower ratings. Interestingly, it also highlighted two other genres with generally positive ratings: Biography and Animation. The reason these genres did not show strong correlations in the previous matrix could be attributed to the relatively small number of movies belonging to these genres. To confirm this, I generated a frequency bar plot of the different genres.
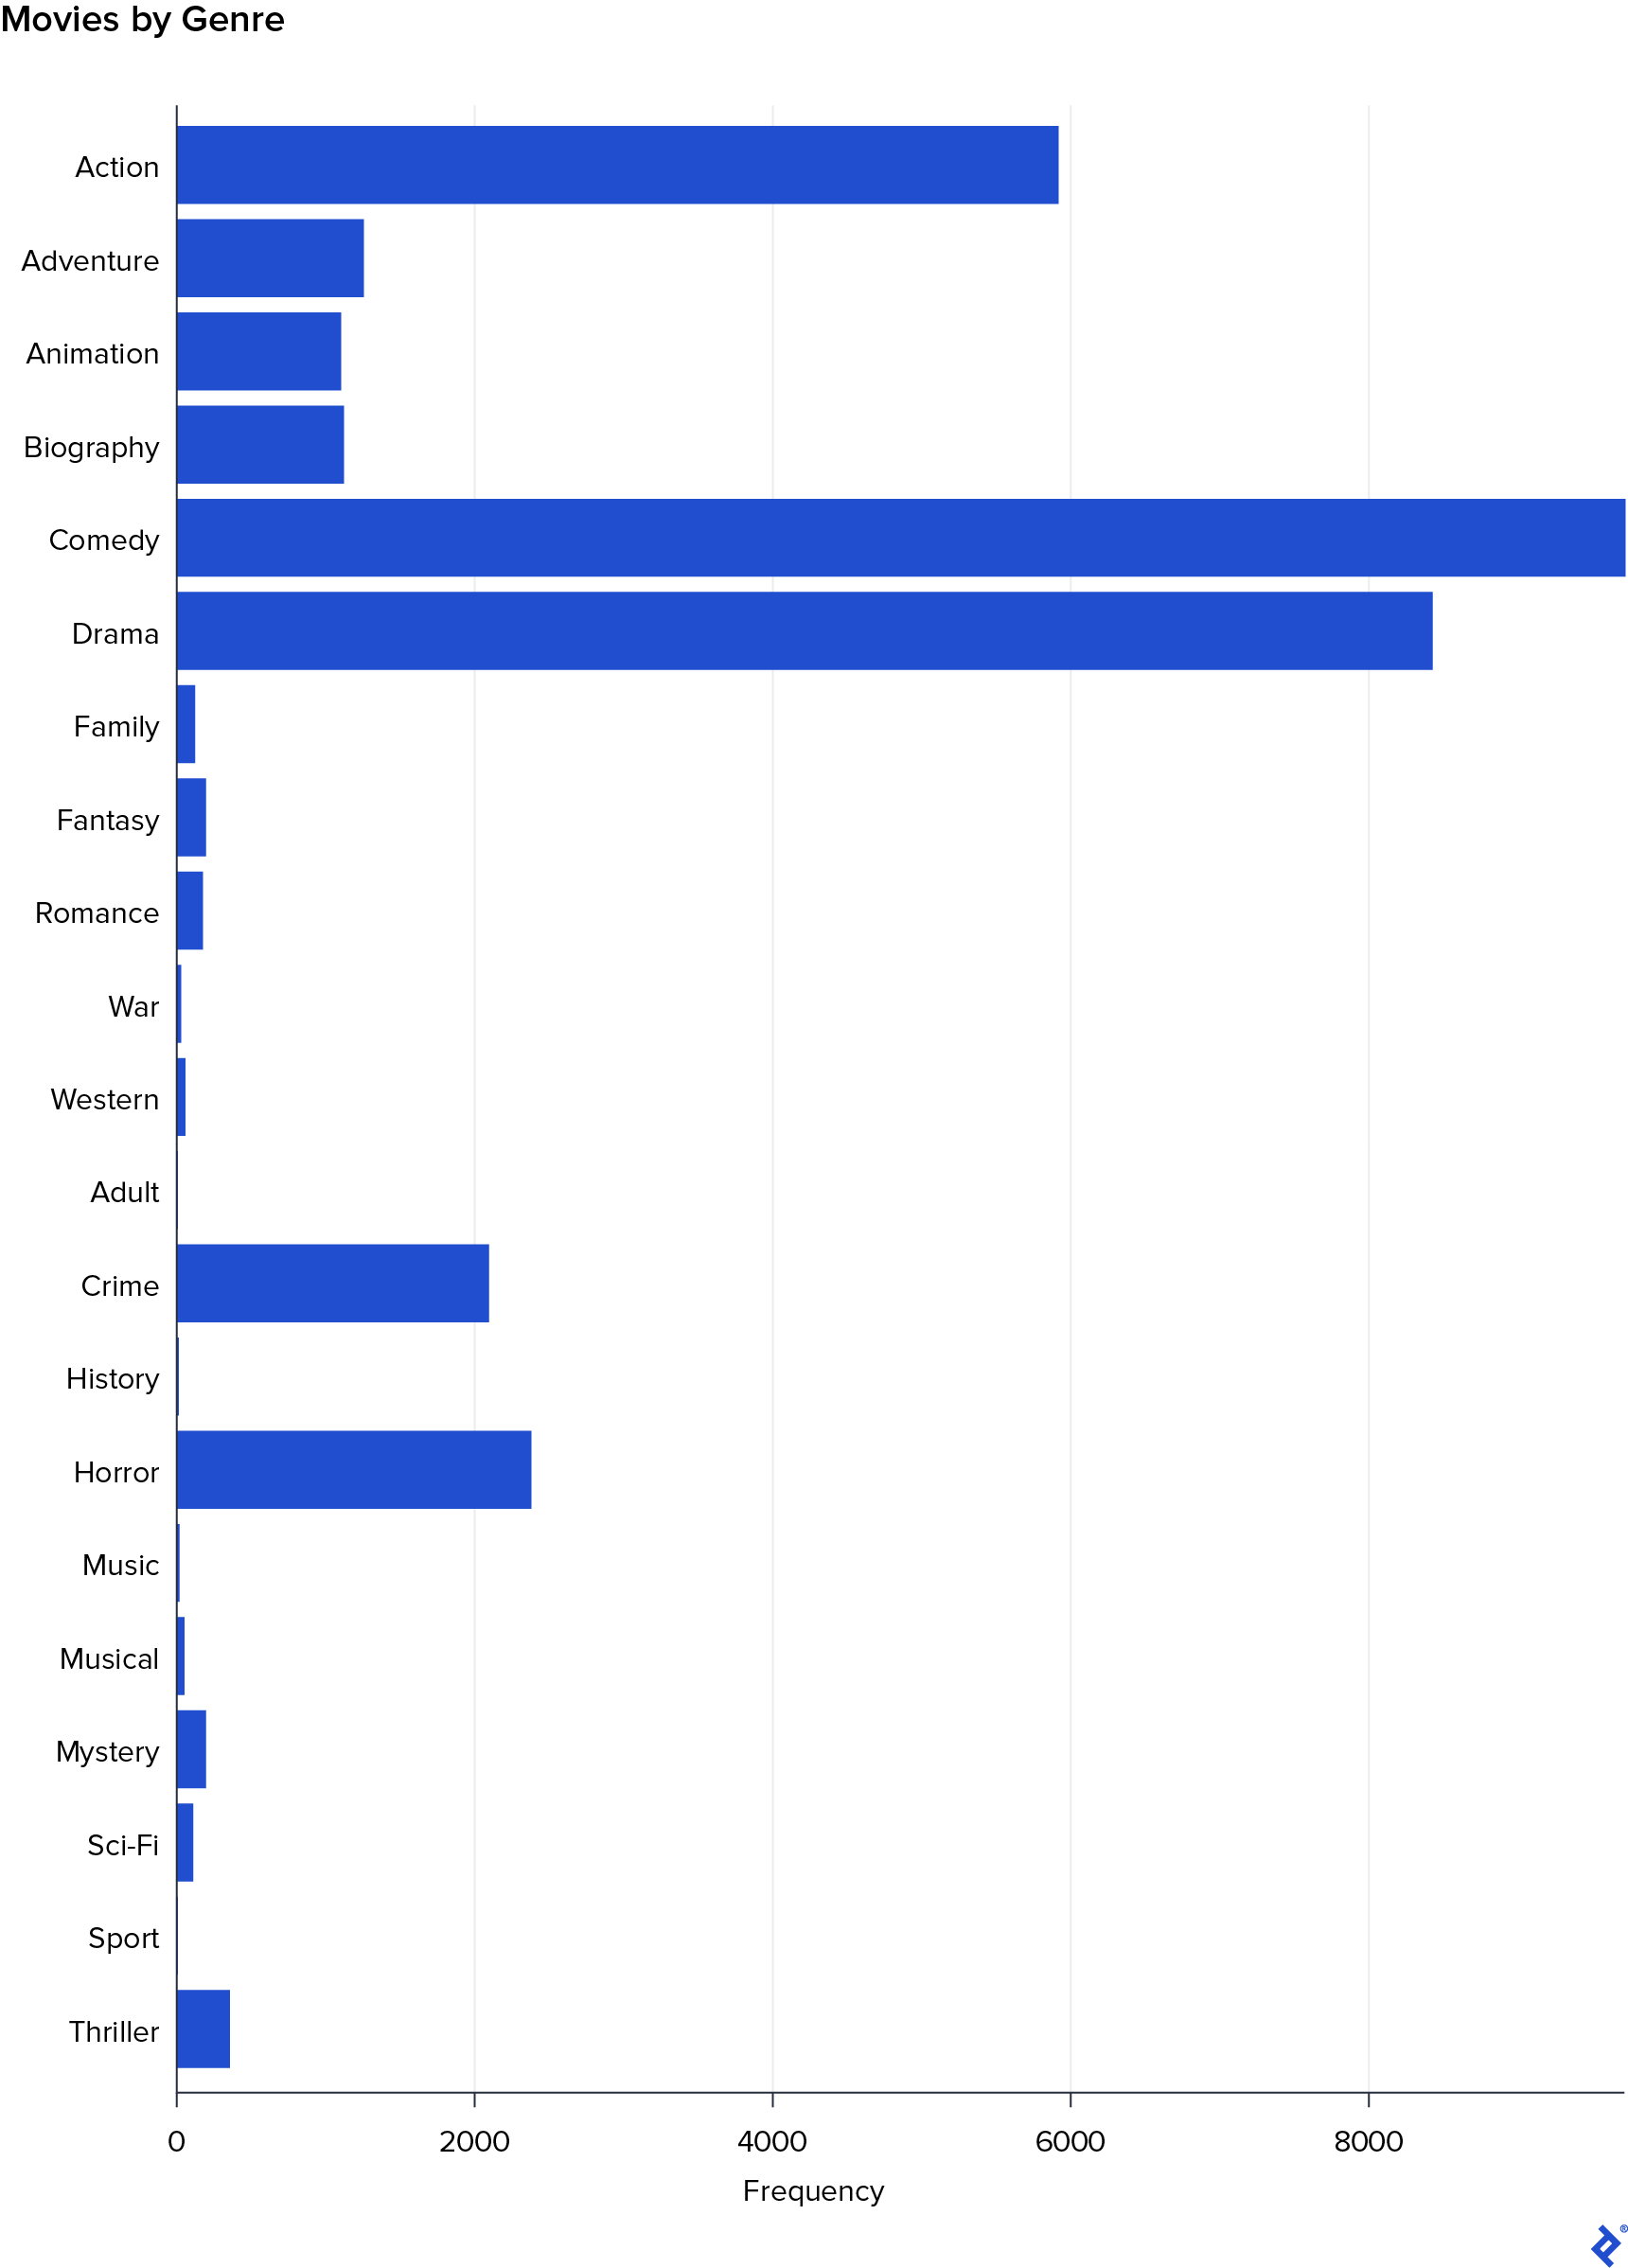
The bar plot confirmed that Biography and Animation had fewer movies in the dataset, as did Sport and Adult. This smaller representation likely explains their weaker correlations with the Rating variable.
Other Variables in the IMDb Rating System
Moving on to the continuous variables, I began by examining the scatter plot of Rating against Year.
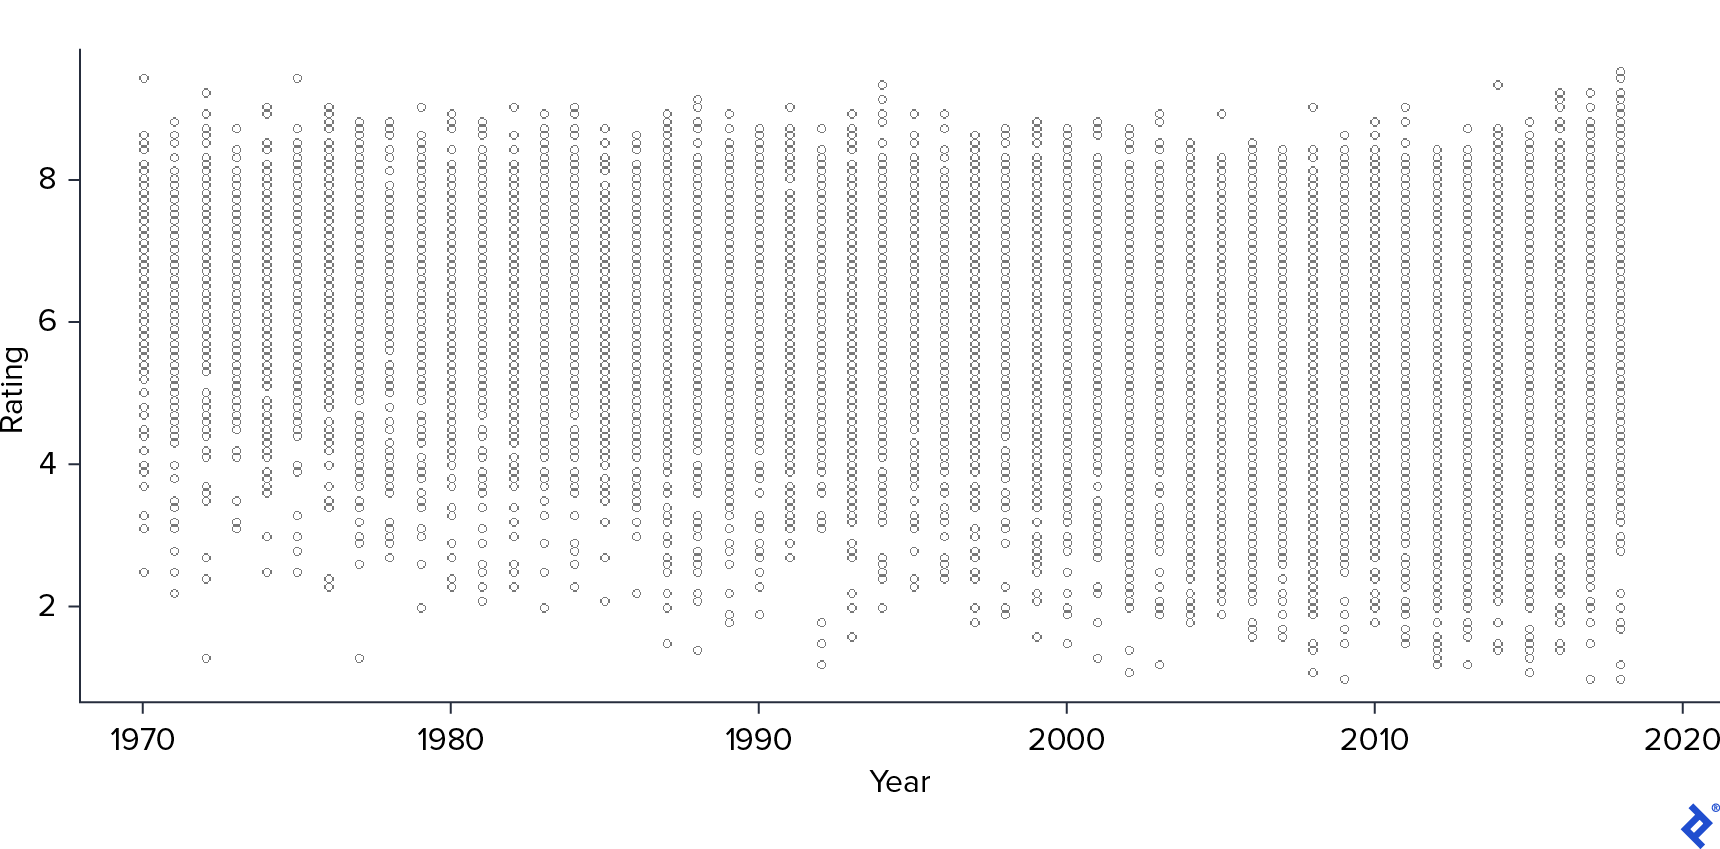
As observed in the correlation matrix, Year showed a negative correlation with Rating. This suggests that as the year of release increases, the variance in movie ratings also tends to increase, with more recent movies receiving a wider spread of ratings, including lower ones.
Next, I generated a scatter plot of Rating against Votes.
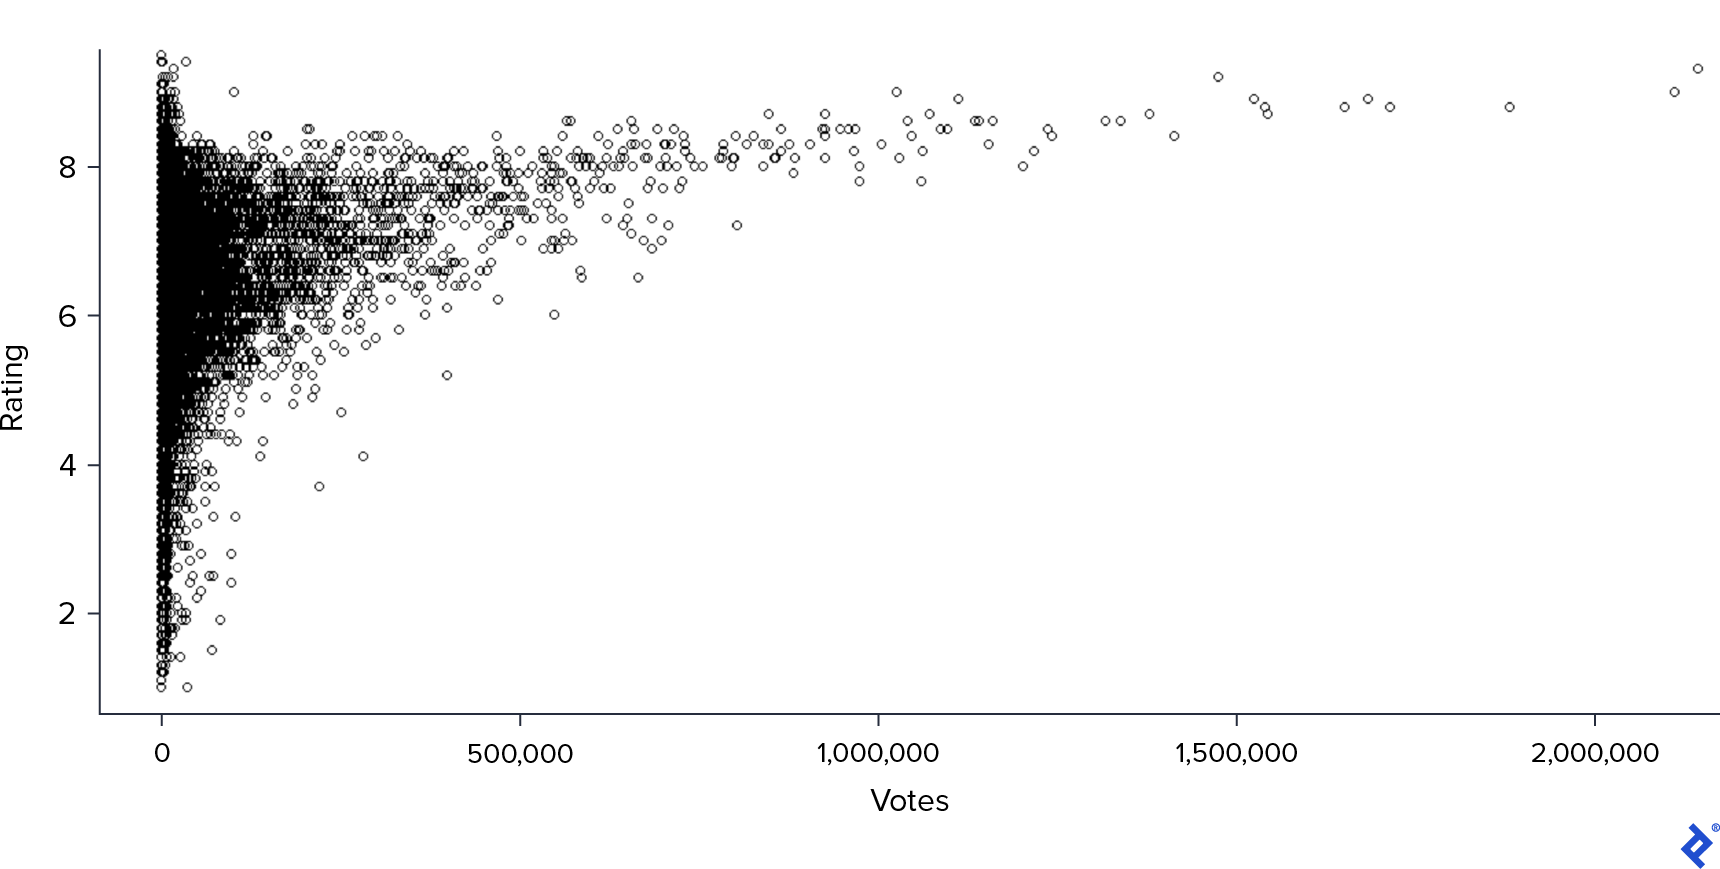
This plot revealed a clearer positive correlation: movies with a higher number of votes generally received higher ratings. However, the majority of movies in the dataset had a relatively low number of votes, and for those movies, there was greater variability in Rating.
Finally, I examined the relationship between Rating and Runtime.
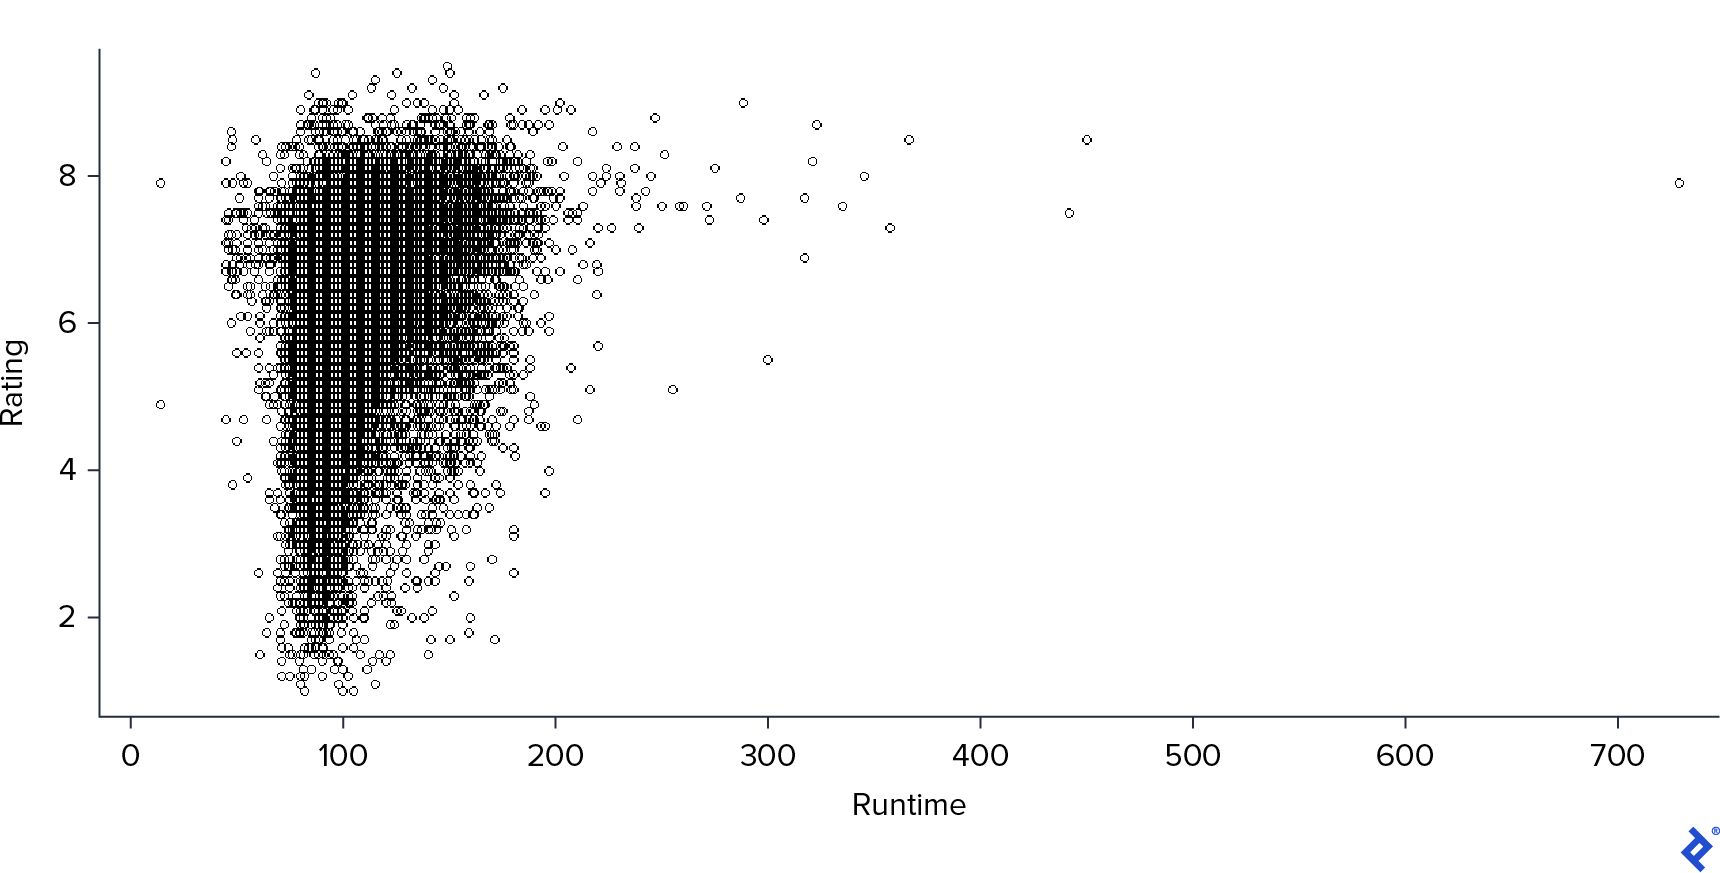
This scatter plot followed a similar pattern to the previous one but with a stronger correlation: longer movies tended to receive higher ratings. It is important to note, however, that there were very few instances of movies with extremely long runtimes.
Refining the IMDb Rating System
Armed with a better understanding of the data, I decided to experiment with different models to predict movie ratings based on the selected fields. My hypothesis was that the difference between the predictions of my best model and the actual Rating would highlight the influence of factors not captured in the dataset, such as acting, screenplay, and cinematography, and potentially reveal what makes certain movies stand out.
I began with the simplest model, linear regression. To evaluate the performance of each model, I used two common metrics: root-mean-square (RMSE) and mean absolute (MAE) errors. These metrics are widely used for regression tasks and are easy to interpret as they are on the same scale as the target variable.
The linear regression model yielded an RMSE of 1.03 and an MAE of 0.78. However, linear models make certain assumptions about the data: independence of errors, a median error of zero, and constant variance. If these assumptions hold true, a plot of “residuals vs. predicted values” should resemble a random cloud with no discernible pattern. To verify this, I created the residual plot.
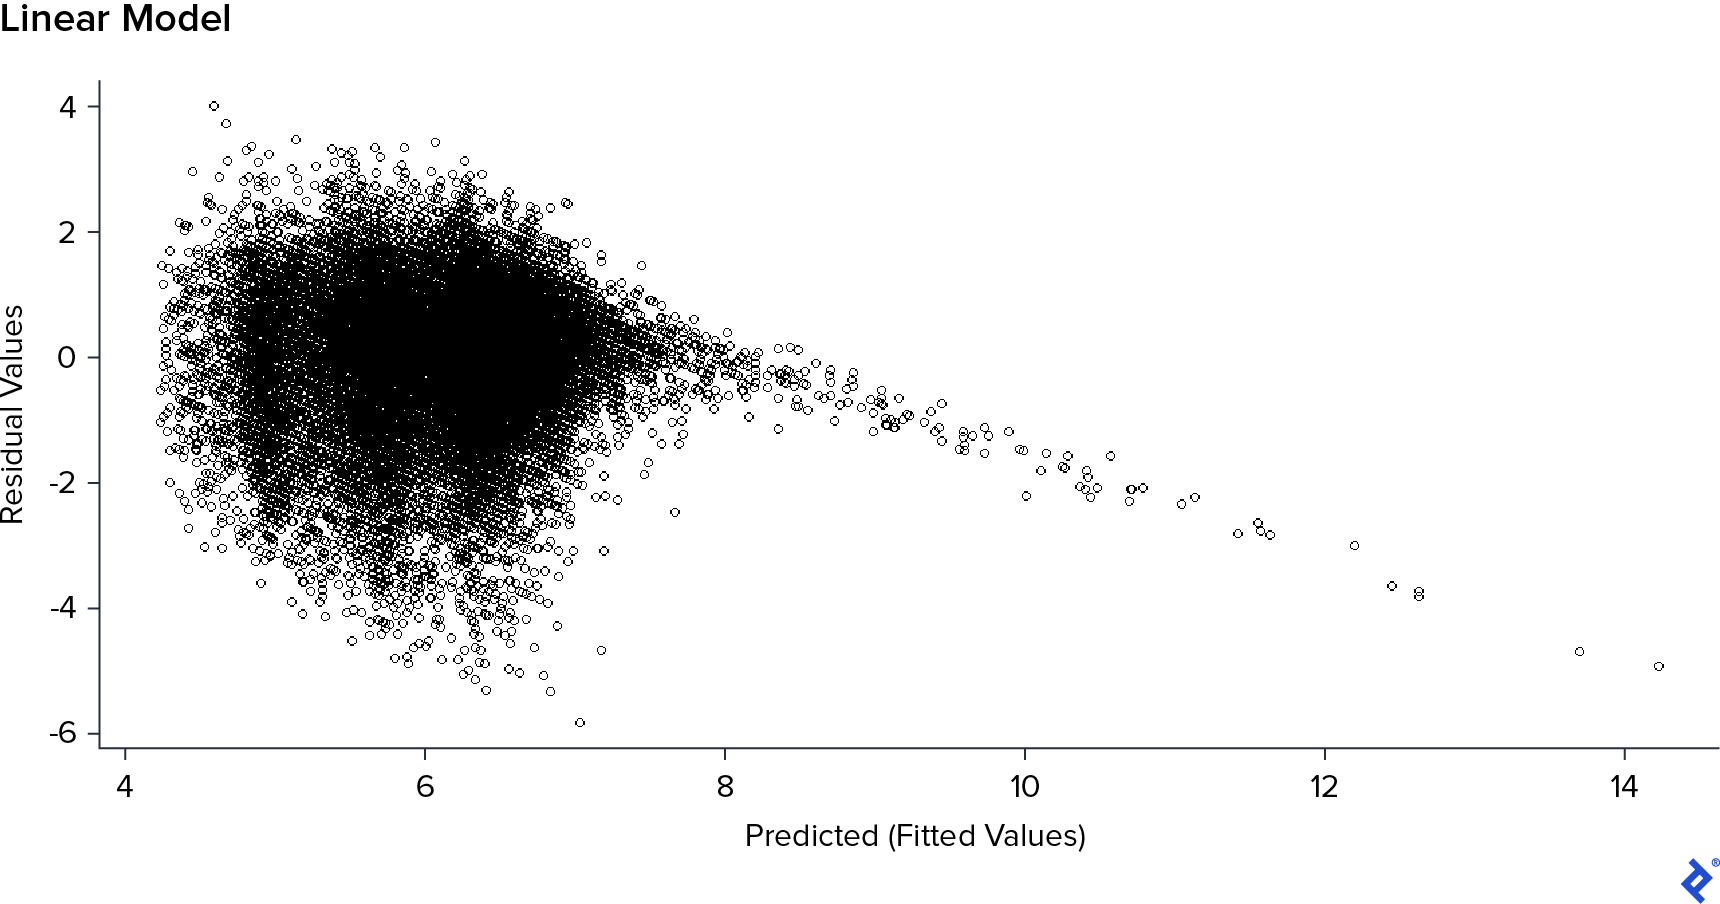
The plot revealed that while the residuals appeared randomly scattered for predicted values up to 7, a clear downward linear trend emerged for higher predicted values. This indicated that the assumptions of the linear model were violated. Additionally, the model produced predicted values exceeding the maximum possible rating of 10, suggesting an overflow issue.
Based on the earlier analysis, I suspected that the Votes field might be contributing to this issue. While a higher number of votes generally correlated with higher ratings, this effect was primarily observed in a few cases with an exceptionally high number of votes. To test this, I retrained the linear model without the Votes field.
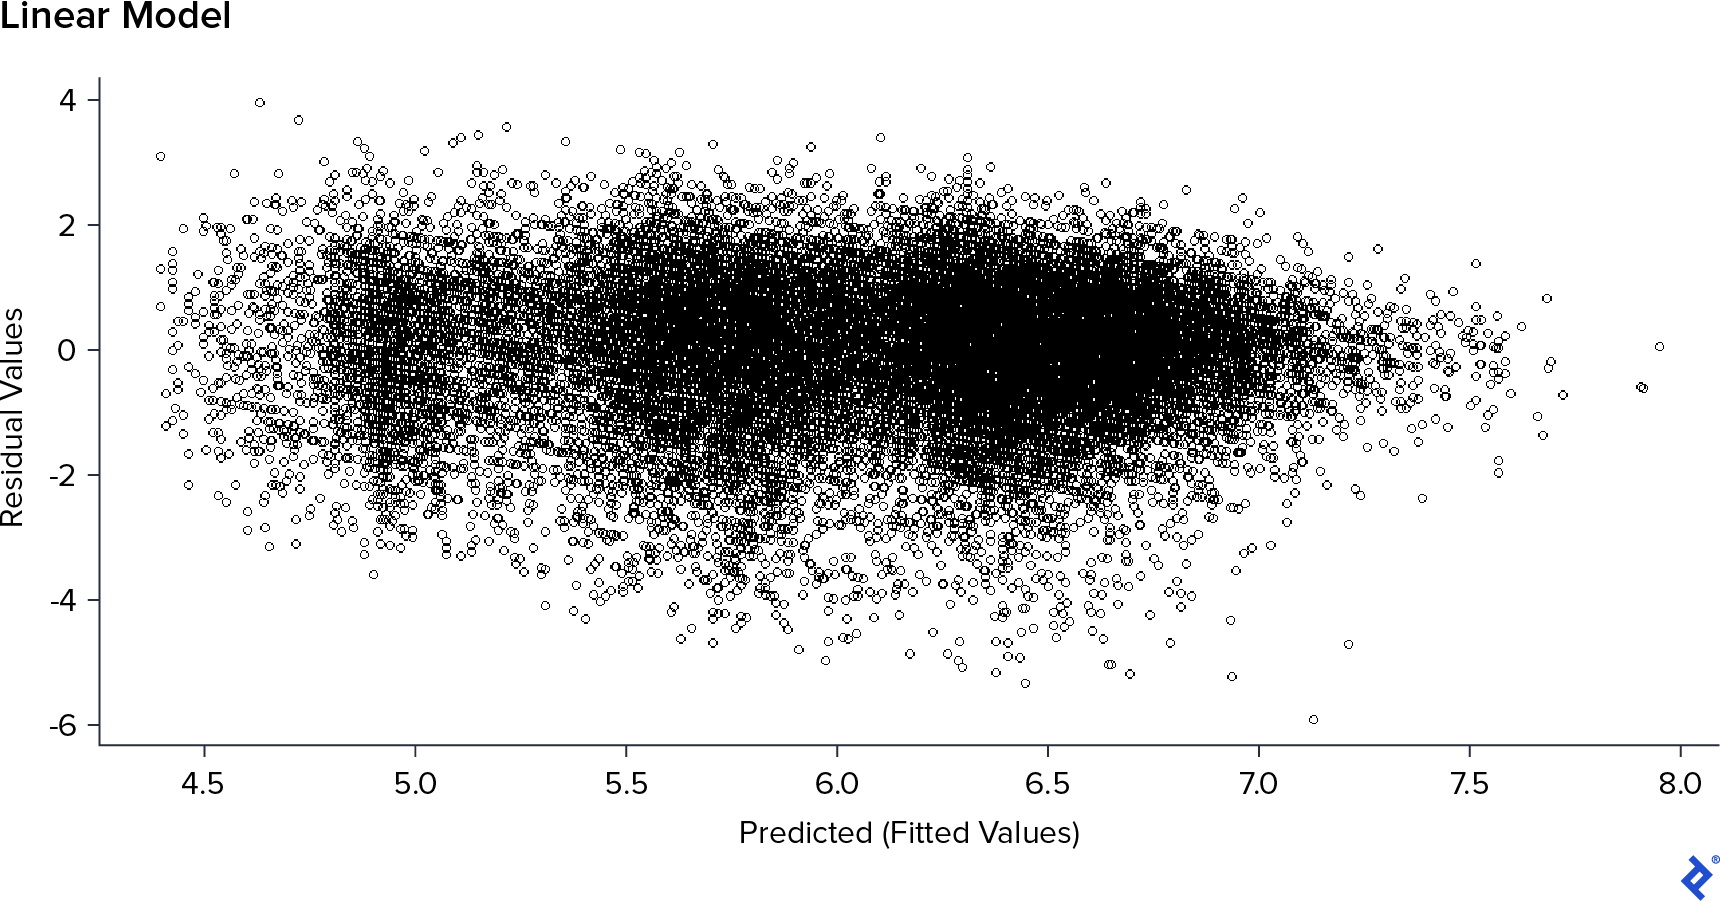
The residual plot showed significant improvement without the Votes field. The residuals were more randomly distributed, and there was no longer an overflow of predicted values. Furthermore, since Votes reflects reviewer activity and not inherent movie characteristics, I decided to exclude this field from further analysis. While removing Votes slightly increased the errors (RMSE: 1.06, MAE: 0.81), I prioritized having a model that met the assumptions and had better feature selection over a marginal improvement in performance on the training data.
Evaluating the Performance of Other Models
Next, I explored various other models to determine which performed best. For each model, I employed random search to find the optimal hyperparameter values and 5-fold cross-validation to mitigate any potential model bias. The table below summarizes the estimated errors for each model:
| Model | RMSE | MAE |
|---|---|---|
| Neural Network | 1.044596 | 0.795699 |
| Boosting | 1.046639 | 0.7971921 |
| Inference Tree | 1.05704 | 0.8054783 |
| GAM | 1.0615108 | 0.8119555 |
| Linear Model | 1.066539 | 0.8152524 |
| Penalized Linear Reg | 1.066607 | 0.8153331 |
| KNN | 1.066714 | 0.8123369 |
| Bayesian Ridge | 1.068995 | 0.8148692 |
| SVM | 1.073491 | 0.8092725 |
All models demonstrated relatively similar performance. This finding prompted me to delve deeper into the data using some of these models. I was particularly interested in understanding the influence of each field on movie ratings. One way to assess feature importance is by examining the coefficients of the linear model. However, to avoid any distortions caused by differing scales, I first standardized the data and retrained the linear model. The resulting weights are visualized in the following graph.
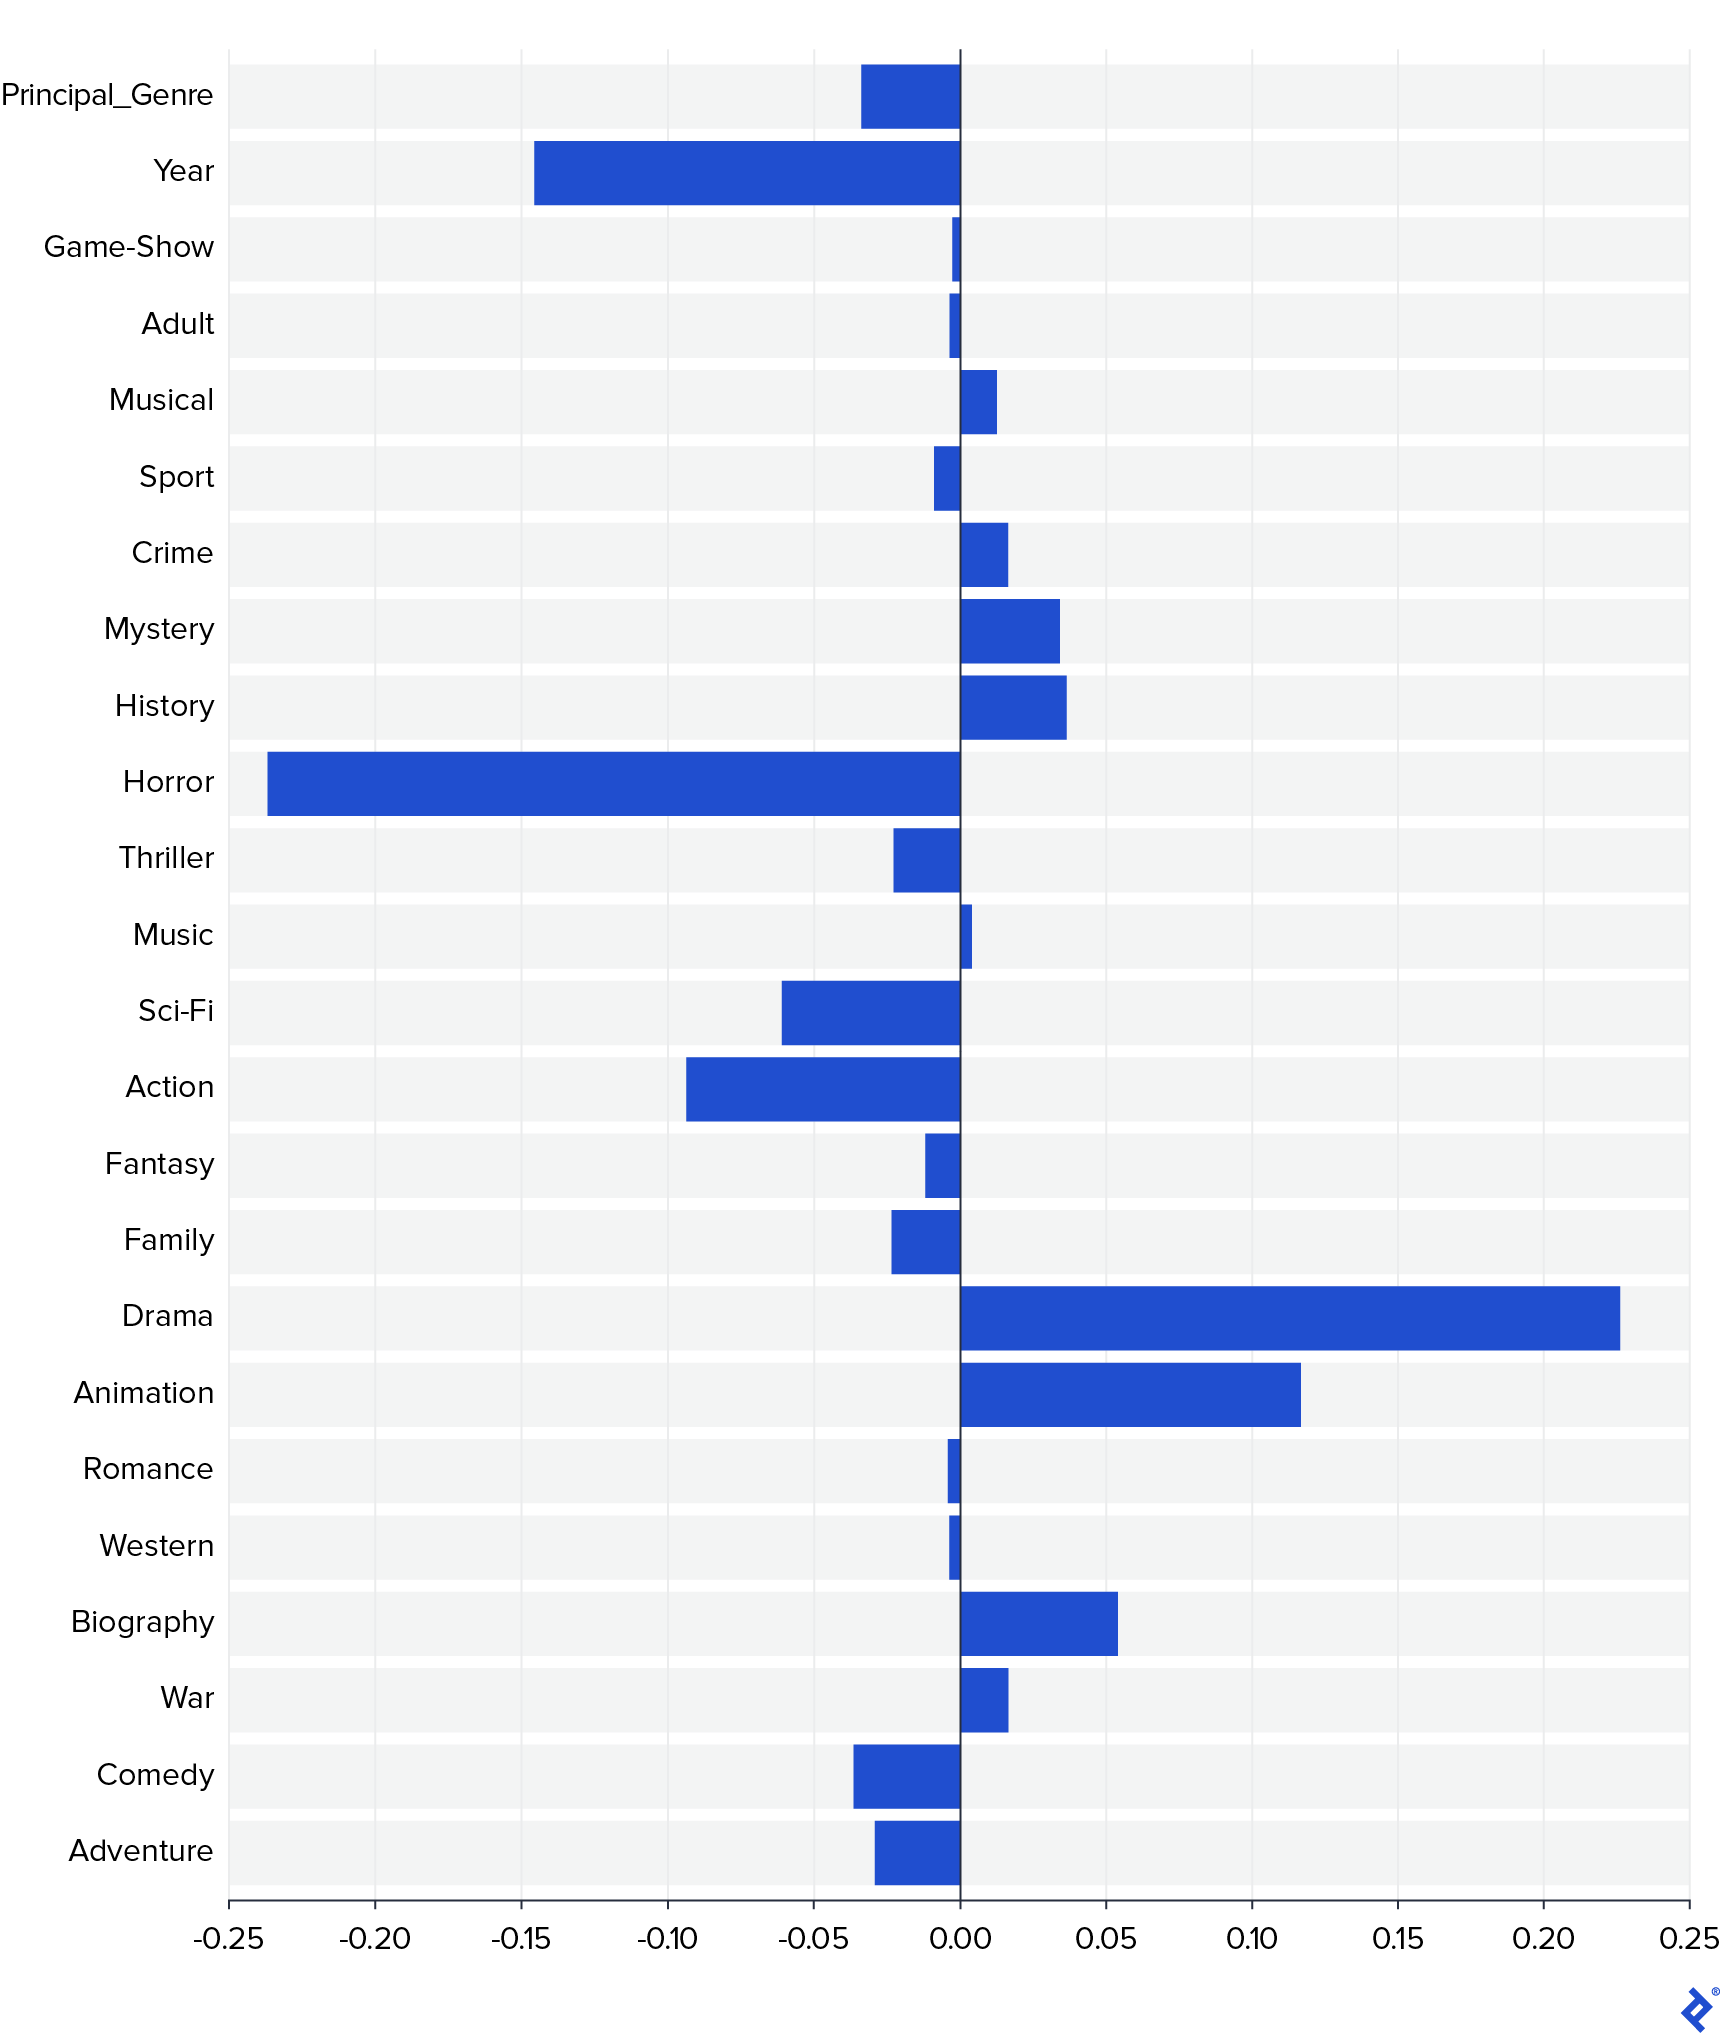
The graph clearly shows that Horror and Drama were the two most influential genres, with Horror having a negative impact on ratings and Drama having a positive impact. Other genres, such as Animation and Biography, also showed positive contributions, while Action, Sci-Fi, and Year had negative contributions. Notably, Principal_Genre did not have a substantial impact, suggesting that the specific genres a movie belongs to matter more than which genre is considered primary.
The generalized additive model (GAM) allowed for a more nuanced understanding of the impact of the continuous variable, Year.
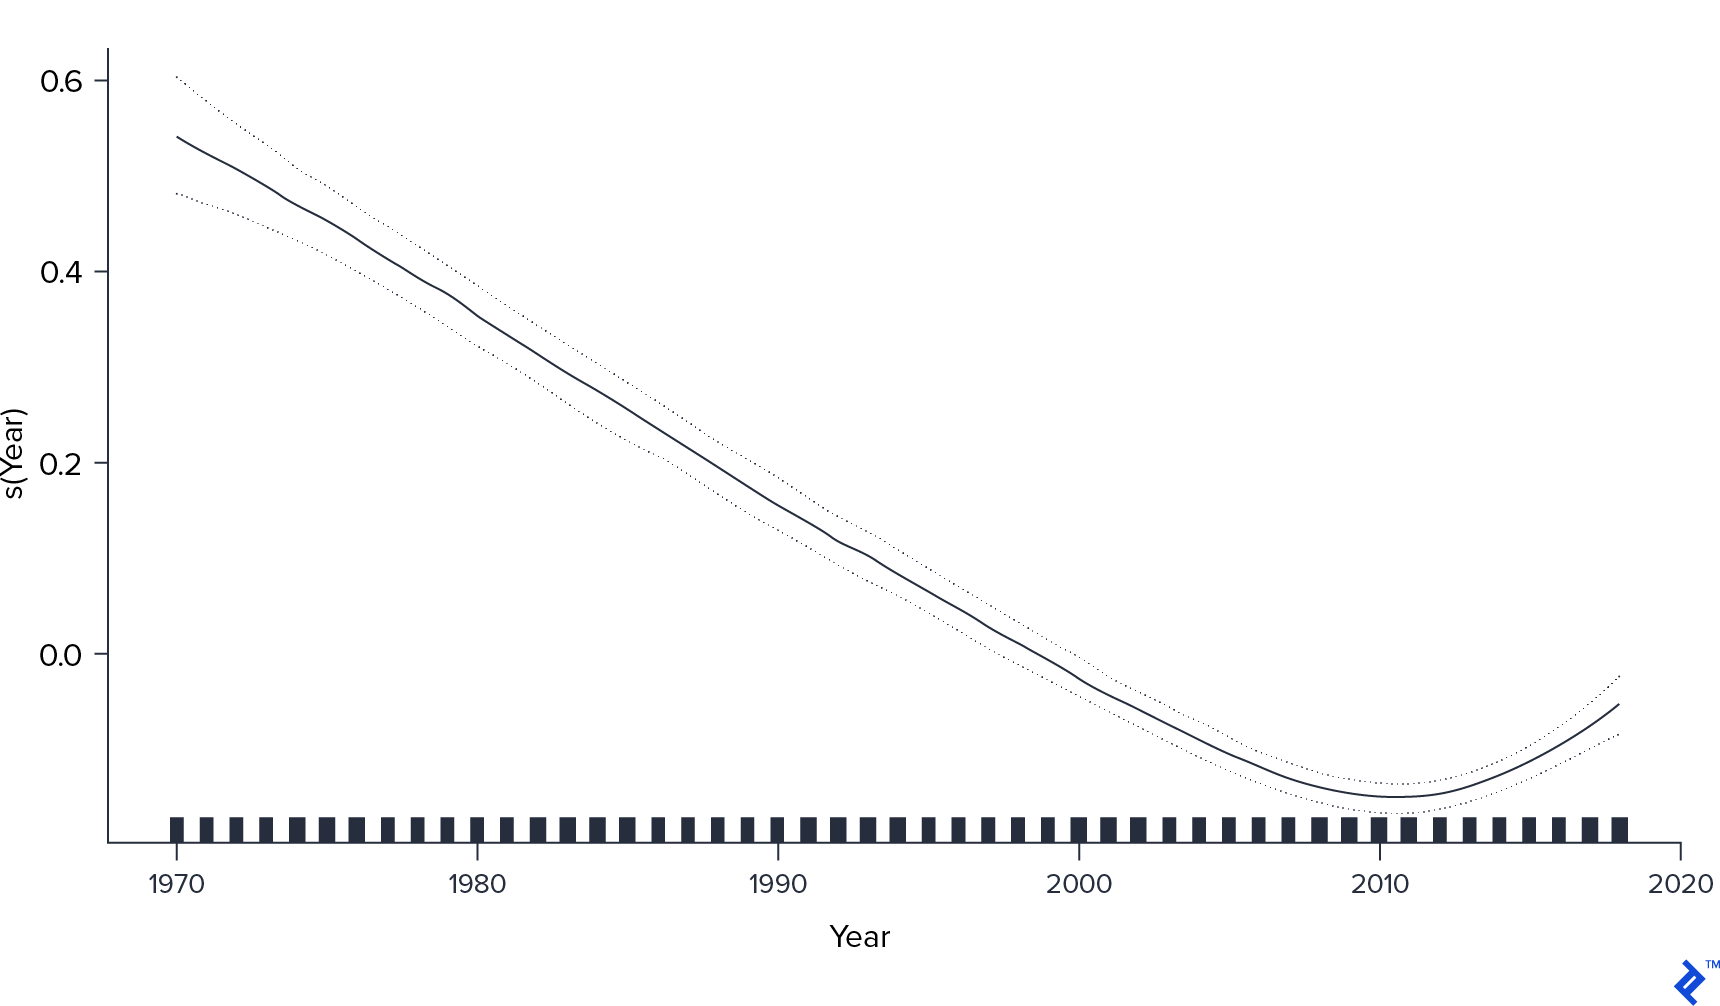
The GAM plot revealed a more intriguing relationship. While recent movies generally received lower ratings, the effect was not constant over time. Ratings reached their lowest point around 2010 but appeared to recover slightly in subsequent years. Further investigation would be needed to understand what factors might have contributed to this trend.
Neural networks achieved the lowest RMSE and MAE, indicating the best performance among the models tested. However, it’s important to note that none of the models achieved perfect prediction accuracy. This finding, however, was not entirely unexpected or undesirable given my objective. The available data allowed for a reasonable estimation of movie ratings, but it was evident that other factors not captured in the dataset play a significant role in influencing movie preferences. These factors likely include aspects like acting, screenplay quality, cinematography, and other subjective elements.
From my perspective, these uncaptured characteristics are precisely what make a movie truly enjoyable and worth watching. It’s not simply about whether a movie falls into a specific genre like drama, action, or science fiction. I seek out movies that offer something unique, thought-provoking, entertaining, or emotionally resonant.
With this in mind, I created a refined rating system by subtracting the predicted rating from the best model (neural network) from the actual IMDb rating. This adjustment aimed to isolate the impact of the uncaptured factors by removing the influence of Genre, Runtime, and Year.
IMDb Rating System Alternative: The Final Results
Let’s compare the top 10 movies based on my refined rating system versus the original IMDb ratings:
IMDb
| Title | Genre | IMDb Rating | Refined Rating |
|---|---|---|---|
| Ko to tamo peva | Adventure,Comedy,Drama | 8.9 | 1.90 |
| Dipu Number 2 | Adventure,Family | 8.9 | 3.14 |
| El señor de los anillos: El retorno del rey | Adventure,Drama,Fantasy | 8.9 | 2.67 |
| El señor de los anillos: La comunidad del anillo | Adventure,Drama,Fantasy | 8.8 | 2.55 |
| Anbe Sivam | Adventure,Comedy,Drama | 8.8 | 2.38 |
| Hababam Sinifi Tatilde | Adventure,Comedy,Drama | 8.7 | 1.66 |
| El señor de los anillos: Las dos torres | Adventure,Drama,Fantasy | 8.7 | 2.46 |
| Mudras Calling | Adventure,Drama,Romance | 8.7 | 2.34 |
| Interestelar | Adventure,Drama,Sci-Fi | 8.6 | 2.83 |
| Volver al futuro | Adventure,Comedy,Sci-Fi | 8.5 | 2.32 |
Mine
| Title | Genre | IMDb Rating | Refined Rating |
|---|---|---|---|
| Dipu Number 2 | Adventure,Family | 8.9 | 3.14 |
| Interestelar | Adventure,Drama,Sci-Fi | 8.6 | 2.83 |
| El señor de los anillos: El retorno del rey | Adventure,Drama,Fantasy | 8.9 | 2.67 |
| El señor de los anillos: La comunidad del anillo | Adventure,Drama,Fantasy | 8.8 | 2.55 |
| Kolah ghermezi va pesar khale | Adventure,Comedy,Family | 8.1 | 2.49 |
| El señor de los anillos: Las dos torres | Adventure,Drama,Fantasy | 8.7 | 2.46 |
| Anbe Sivam | Adventure,Comedy,Drama | 8.8 | 2.38 |
| Los caballeros de la mesa cuadrada | Adventure,Comedy,Fantasy | 8.2 | 2.35 |
| Mudras Calling | Adventure,Drama,Romance | 8.7 | 2.34 |
| Volver al futuro | Adventure,Comedy,Sci-Fi | 8.5 | 2.32 |
As expected, there aren’t drastic changes in the top rankings. This is because the model errors were relatively small, and the top-rated movies likely possess qualities that are captured by both the model and general viewer sentiment.
Now, let’s examine the bottom 10 movies according to both ranking systems:
IMDb
| Title | Genre | IMDb Rating | Refined Rating |
|---|---|---|---|
| Holnap történt - A nagy bulvárfilm | Comedy,Mystery | 1 | -4.86 |
| Cumali Ceber: Allah Seni Alsin | Comedy | 1 | -4.57 |
| Badang | Comedy,Fantasy | 1 | -4.74 |
| Yyyreek!!! Kosmiczna nominacja | Comedy | 1.1 | -4.52 |
| Proud American | Drama | 1.1 | -5.49 |
| Browncoats: Independence War | Action,Sci-Fi,War | 1.1 | -3.71 |
| The Weekend It Lives | Comedy,Horror,Mystery | 1.2 | -4.53 |
| Bolívar: el héroe | Animation,Biography | 1.2 | -5.34 |
| Rise of the Black Bat | Action,Sci-Fi | 1.2 | -3.65 |
| Hatsukoi | Drama | 1.2 | -5.38 |
Mine
| Title | Genre | IMDb Rating | Refined Rating |
|---|---|---|---|
| Proud American | Drama | 1.1 | -5.49 |
| Santa and the Ice Cream Bunny | Family,Fantasy | 1.3 | -5.42 |
| Hatsukoi | Drama | 1.2 | -5.38 |
| Reis | Biography,Drama | 1.5 | -5.35 |
| Bolívar: el héroe | Animation,Biography | 1.2 | -5.34 |
| Hanum & Rangga: Faith & The City | Drama,Romance | 1.2 | -5.28 |
| After Last Season | Animation,Drama,Sci-Fi | 1.7 | -5.27 |
| Barschel - Mord in Genf | Drama | 1.6 | -5.23 |
| Rasshu raifu | Drama | 1.5 | -5.08 |
| Kamifûsen | Drama | 1.5 | -5.08 |
Similarly, the bottom rankings remain relatively consistent, although my refined list includes a higher proportion of dramas compared to the original IMDb rankings. This suggests that some dramas might be overrated simply for belonging to that genre.
Perhaps the most interesting comparison is the list of 10 movies with the greatest discrepancies between the original IMDb rating and my refined rating. These movies stand out because their uncaptured qualities contribute significantly to their overall appeal (or lack thereof), surpassing what would be expected based on their genre, runtime, and year of release.
| Title | IMDb Rating | Refined Rating | Difference |
|---|---|---|---|
| Kanashimi no beradonna | 7.4 | -0.71 | 8.11 |
| Jesucristo Superstar | 7.4 | -0.69 | 8.09 |
| Pink Floyd The Wall | 8.1 | 0.03 | 8.06 |
| Tenshi no tamago | 7.6 | -0.42 | 8.02 |
| Jibon Theke Neya | 9.4 | 1.52 | 7.87 |
| El baile | 7.8 | 0.00 | 7.80 |
| Santa and the Three Bears | 7.1 | -0.70 | 7.80 |
| La alegre historia de Scrooge | 7.5 | -0.24 | 7.74 |
| Piel de asno | 7 | -0.74 | 7.74 |
| 1776 | 7.6 | -0.11 | 7.71 |
If I were a movie director aiming to produce a film with a high IMDb rating based on this analysis, I might be inclined to create a lengthy animated biographical drama that’s a remake of a classic film, such as “Amadeus.” While such a movie might achieve a favorable IMDb ranking, its commercial success is less certain.
What are your thoughts on the movies highlighted by my refined rating system? Do you agree with their rankings? Share your opinions in the comments below!