We were successful in our goal to develop a WebVR Proof of Concept! Having finished the simulation in earlier blog entries, we’re ready to get artistic.
The arrival of VR marks a significant shift for designers and developers.
The smartphone revolution began in 2007 with the release of the first iPhone. By 2012, “mobile-first” and “responsive” web design were standard practice. Facebook and Oculus debuted the first mobile VR headset in 2019. Let’s get this going!
The “mobile-first” internet was not a fad, and I believe the “VR-first” internet will be just as revolutionary. I demonstrated the technical feasibility in your existing browser in the previous three articles and demos.
We’re constructing a celestial gravity simulation of spinning planets in case you’re joining us in the middle of the series.
- Part 1: Intro and Architecture
- Part 2: Utilizing Web Workers for Multithreading
- Part 3: Overcoming Performance Bottlenecks with WebAssembly and AssemblyScript
It’s time to get creative after laying the groundwork. We will investigate canvas, WebVR, and user experience in the following two posts.
- Part 4: Canvas Data Visualization (this post)
- Part 5: WebVR Data Visualization
Today, we’ll make our simulation come to life. Looking back, I realized how much more eager and engaged I became in finishing the project after I began working on the visualizers. The visualizations piqued the curiosity of others.
This simulation’s goal was to investigate the technologies that will power WebVR - Virtual Reality in the browser - and the coming VR-first web. These same technologies have the potential to revolutionize browser-based computing.
Today, we’ll begin by developing a canvas visualization to complete our Proof of Concept.

In the last installment, we’ll examine VR design and create a WebVR version of this project.

Starting Simple: Utilizing console.log()
Returning to the real world, let’s create some visualizations for our “n-body” simulation in the browser. I’ve previously utilized canvas in web video applications, but never as an artist’s canvas. Let’s see what we can come up with.
You may recall that we delegated visualization to nBodyVisualizer.js in our project architecture.
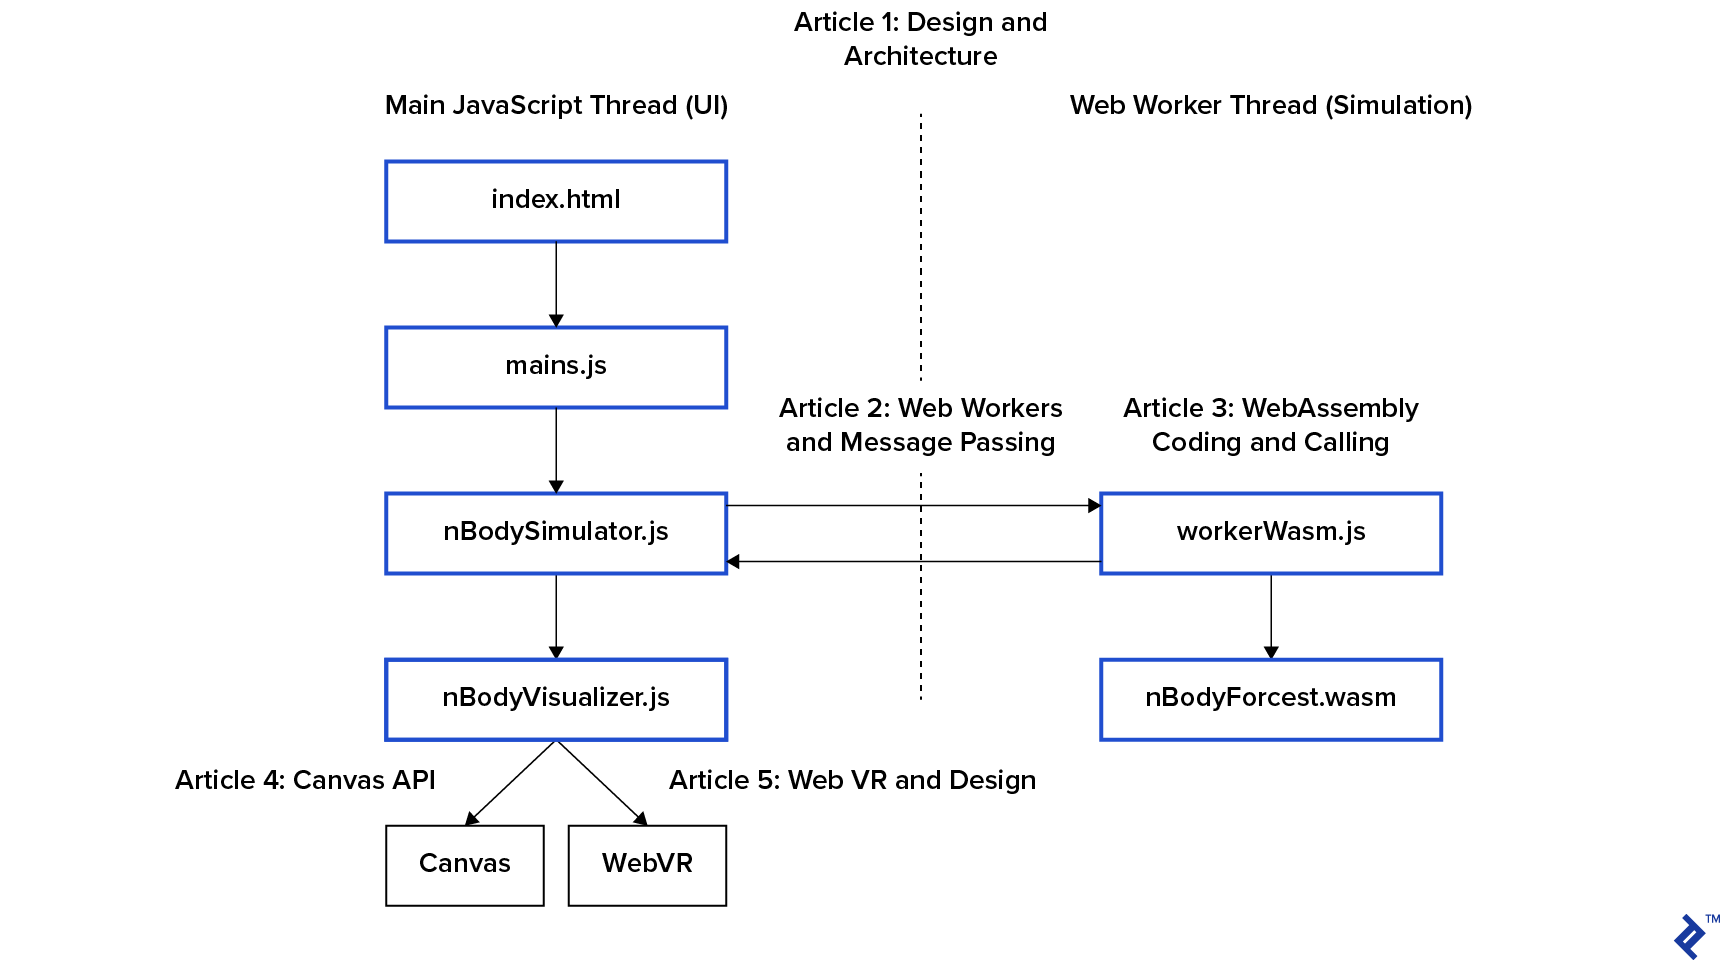
nBodySimulator.js includes a simulation loop start() that calls its step() method, and the bottom of step() calls this.visualize()
| |
When we click the green button, the main thread introduces ten random bodies into the system. We tweaked the button code in the first post, and you can view it in the repository. here. These bodies are useful for testing a proof of concept, but keep in mind that we are in O(n²) performance danger zone.
Humans are hardwired to care about what they can see, therefore trimDebris() removes objects that are flying out of sight to avoid slowing down the rest of the simulation. This is the distinction between perceived and actual performance.
Let’s move on to the final this.visualize() now that we’ve covered everything else.
| |
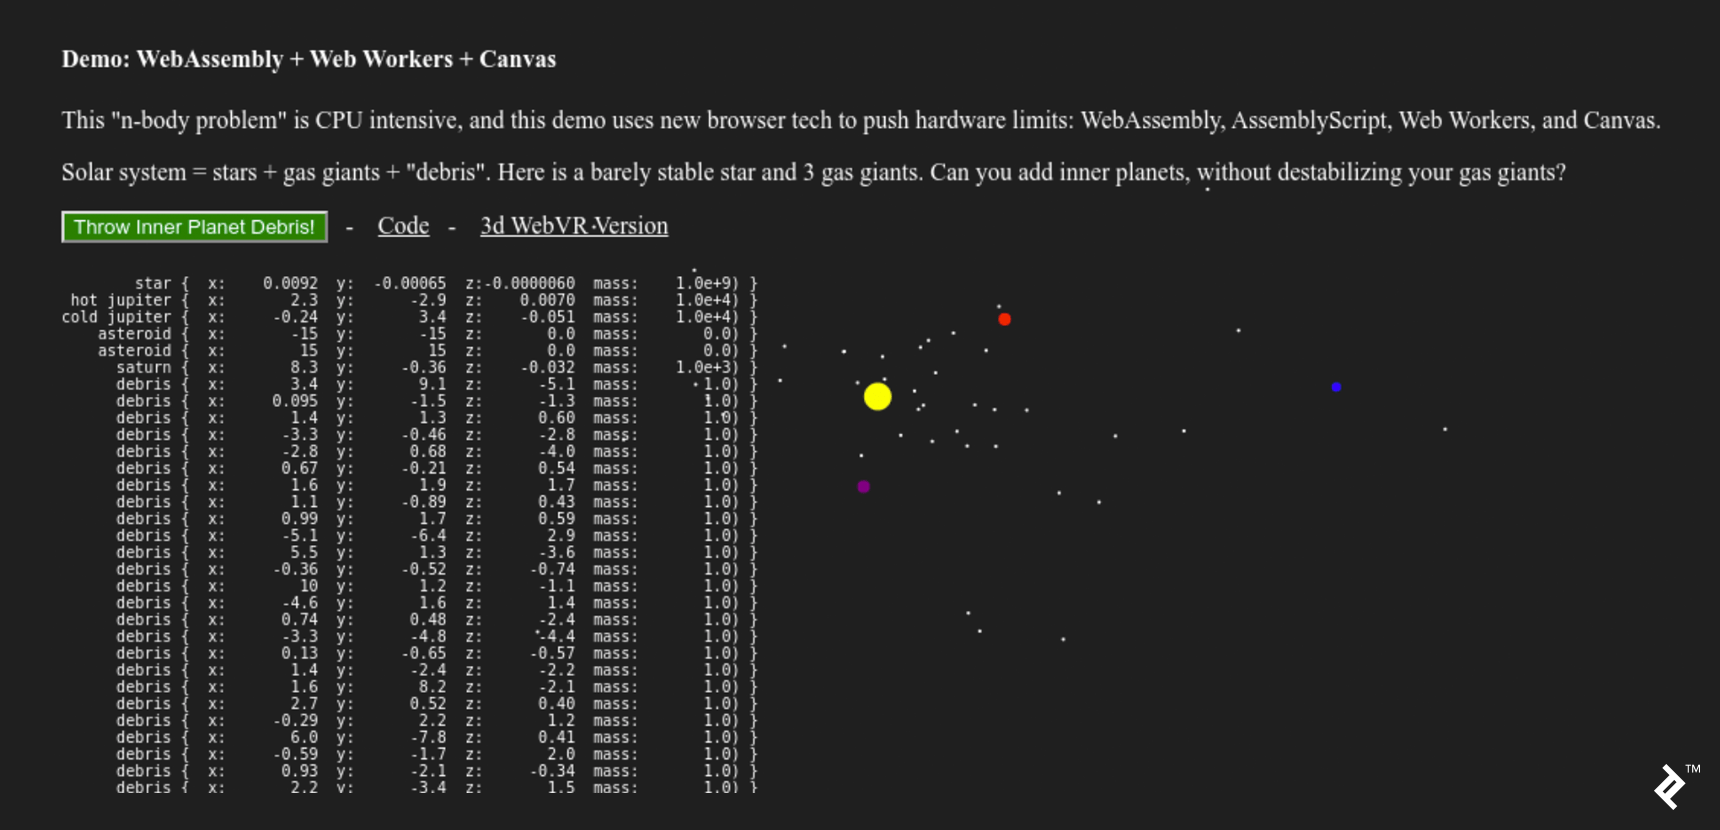
These two functions allow us to use a variety of visualizers. The canvas version includes two visualizers:
| |
The first visualizer in the canvas version is a table of white numbers rendered as HTML. A black canvas element sits beneath the second visualizer.
To accomplish this, I began with a simple base class in nBodyVisualizer.js:
| |
This class outputs to the console (every 33ms!) and keeps track of an htmlElement, which we’ll use in subclasses to make them simple to define in main.js.
This is the most basic solution.
However, while this console visualization is straightforward, it does not actually “work.” The browser console (as well as browsing humans) are not designed to handle log messages at a rate of 33ms. Let’s look for the next simplest thing that might work.
Visualizing Data from Simulations
Printing text to an HTML element was the next “pretty print” step. This pattern is also used in the canvas implementation.
It’s worth noting that we’re keeping a reference to an htmlElement, on which the visualizer will draw. It has a mobile-first design, like everything else on the web. This displays the data table of objects and their coordinates to the left of the page on a desktop. We omit it on mobile because it would result in visual clutter.
| |
This “data stream” visualizer serves two purposes:
- It allows you to “sanity check” the simulation’s inputs to the visualizer. This is a “debug” window.
- It’s interesting to look at, so let’s keep it for the desktop demo!
Let’s discuss graphics and canvas now that we’re pretty confident in our inputs.
Visualizing Simulations Using a 2D Canvas
A “Game Engine” is a “Simulation Engine” that includes explosions. Because both concentrate on asset pipelines, streaming level loading, and a slew of other incredibly dull tasks that should go unnoticed, they are both incredibly complex tools.
With “mobile-first” design, the web has also introduced its own set of “things that should never be noticed.” If the browser is resized, our canvas’s CSS will resize the canvas element in the DOM, forcing our visualizer to adjust or face user wrath.
| |
The resize() method in the nBodyVisualizer base class and the canvas implementation are driven by this requirement.
| |
As a result, our visualizer has three key properties:
this.vis- can be used to draw primitive shapesthis.sizeXthis.sizeY- the drawing area’s dimensions
Design Considerations for Canvas 2D Visualization
Our resizing method contradicts the default canvas implementation. If we were visualizing a product or a data graph, we’d want to:
- Draw on the canvas (at a specific size and aspect ratio)
- Then, during page layout, have the browser resize that drawing into the DOM element.
The product or graph is the main focus of the experience in this more common use case.
Instead, our visualization is a theatrical depiction of the vastness of space, dramatically illustrated by launching dozens of tiny worlds into the void for our amusement.
Our celestial bodies express that space by being modest, with diameters ranging from 0 to 20 pixels. To create a sense of “scientific” spaciousness, this resizing scales the space between the dots while also increasing perceived velocity.
We initialize bodies with a drawSize proportional to mass to create a sense of scale between objects with vastly different masses:
| |
Creating Custom Solar Systems
We now have all of the tools we need to create our visualization in main.js:
| |
You might notice the two “asteroids” at the bottom. These zero-mass objects are a hack that “pins” the simulation’s smallest viewport to a 30x30 area centered on 0,0.
Our paint function is now ready. Because the cloud of bodies can “wobble” away from the origin (0,0,0), we must shift in addition to scale.
When the simulation feels natural, we’re finished. There is no “correct” way to accomplish this. To arrange the planets’ initial positions, I simply fiddled with the numbers until they held together long enough to be interesting.
| |
The actual canvas drawing code is only five lines long, each beginning with this.vis. The remainder of the code is the scene’s grip.
Art Is Never Finished, Only Abandoned
When clients appear to be spending money that will not benefit them, now is an excellent time to bring it up. Investing in art is a financial decision.
The client (me) for this project decided to switch from canvas implementation to WebVR. I desired a visually appealing WebVR demo. So, let’s get this wrapped up and move on to the next one!
We could take this canvas project in a variety of directions with what we’ve learned. As you may recall from the second post, we are creating multiple copies of the body data in memory:

If performance is more important than design complexity, the canvas’s memory buffer can be passed directly to WebAssembly. This eliminates the need for a few memory copies, which improves performance:
- CanvasRenderingContext2D prototype to AssemblyScript
- OffscreenCanvas — Speed up Your Canvas Operations with a Web Worker
These projects, like WebAssembly and AssemblyScript, are dealing with upstream compatibility issues as the specifications for these incredible new browser capabilities evolve.
All of these projects, as well as all of the open-source code I used here, are laying the groundwork for the VR-first internet commons of the future. We appreciate your help!
In the final post, we’ll look at some key design differences between developing a VR scene and a flat web page. And, because VR is difficult, we’ll use a WebVR framework to create our spinning world. I chose Google’s A-Frame, which is also canvas-based.
It has been a long road to get to the start of WebVR. However, this series was not about the A-Frame hello world demo. I wrote this series because I was excited to demonstrate the browser technology that will underpin the internet’s VR-first worlds.