Donald Knuth famously stated that “premature optimization is the root of all evil.” However, there comes a point, often in mature projects handling significant loads, when optimization becomes unavoidable. This article will delve into five common strategies to enhance the performance of your web project’s code. While I’ll be using Django for demonstration, the underlying principles hold true for other frameworks and languages as well. Through these methods, I will illustrate how to reduce a query’s response time from 77 seconds to a mere 3.7 seconds.

The code snippets used in this article are derived from a real-world project I’ve worked on and effectively showcase performance optimization techniques. If you’d like to follow along and witness the results firsthand, you can access the initial codebase on GitHub. Feel free to implement the corresponding changes as you progress through the article. For this demonstration, I’ll be utilizing Python 2, as certain third-party packages are not yet compatible with Python 3.
Introducing the Application
Our web project is a straightforward one, designed to track real estate listings for different countries. As such, it comprises only two models:
| |
The abstract HashableModel equips any inheriting model with a hash property. This property encapsulates the instance’s primary key and model content type, effectively concealing sensitive data like instance IDs by replacing them with a hash. This can be particularly valuable in projects with multiple models where a centralized mechanism is needed to decode hashes and determine appropriate actions for different model instances from various classes. While hashing isn’t strictly necessary for our small project, as we can manage without it, it serves as a useful example for demonstrating certain optimization techniques, hence its inclusion.
Let’s examine the Hasher class:
| |
Since we aim to expose this data via an API endpoint, we’ll integrate Django REST Framework and define the necessary serializers and view:
| |
| |
With our database populated with sample data (100,000 house instances generated using factory-boy: 50,000 for one country, 40,000 for another, and 10,000 for a third), we’re all set to evaluate our application’s performance.
Performance Optimization: The Art of Measurement
When it comes to project performance, there’s a myriad of aspects we can measure:
- Execution time
- Code line count
- Function call frequency
- Memory allocation
- And more…
However, not all of these metrics hold equal significance in gauging our project’s efficiency. Generally, two metrics stand out as the most critical: execution duration and memory consumption.
In web projects, response time reigns supreme. This metric represents the time taken for the server to receive a user-generated request, process it, and send back the corresponding result. A swift response time is crucial for preventing user frustration and page abandonment due to prolonged waiting.
In the realm of programming, analyzing project performance is known as profiling. To profile our API endpoint’s performance, we’ll employ the Silk package. Upon installation, making a call to /api/v1/houses/?country=5T22RI (the hash representing the country with 50,000 house entries) yields the following results:
200 GET
/api/v1/houses/
77292ms overall
15854ms on queries
50004 queries
The total response time clocks in at a sluggish 77 seconds, with a significant 16 seconds consumed by database queries. Notably, a staggering 50,000 queries are executed during this process. Such substantial numbers signal ample room for improvement, so let’s get started.
1. Optimizing Database Queries: A Foundation for Performance
A recurring theme in performance optimization advice is the importance of fine-tuning database queries. This case is no exception. In fact, we can implement several adjustments to our queries to expedite response times significantly.
1.1 Fetching Data Efficiently: Embracing Bulk Retrieval
A closer inspection of the 50,000 queries reveals a pattern of redundant requests to the houses_country table:
200 GET
/api/v1/houses/
77292ms overall
15854ms on queries
50004 queries
| At | Tables | Joins | Execution Time (ms) |
|---|---|---|---|
| +0:01:15.874374 | "houses_country" | 0 | 0.176 |
| +0:01:15.873304 | "houses_country" | 0 | 0.218 |
| +0:01:15.872225 | "houses_country" | 0 | 0.218 |
| +0:01:15.871155 | "houses_country" | 0 | 0.198 |
| +0:01:15.870099 | "houses_country" | 0 | 0.173 |
| +0:01:15.869050 | "houses_country" | 0 | 0.197 |
| +0:01:15.867877 | "houses_country" | 0 | 0.221 |
| +0:01:15.866807 | "houses_country" | 0 | 0.203 |
| +0:01:15.865646 | "houses_country" | 0 | 0.211 |
| +0:01:15.864562 | "houses_country" | 0 | 0.209 |
| +0:01:15.863511 | "houses_country" | 0 | 0.181 |
| +0:01:15.862435 | "houses_country" | 0 | 0.228 |
| +0:01:15.861413 | "houses_country" | 0 | 0.174 |
This inefficiency stems from the lazy nature of query sets in Django. In essence, a query set remains unevaluated, refraining from hitting the database until data retrieval is explicitly required. Moreover, it fetches only the specified data, necessitating additional requests for any supplementary information.
This lazy evaluation is precisely the culprit in our scenario. When we retrieve the query set using House.objects.filter(country=country), Django initially fetches a list of all houses associated with the specified country. However, during the serialization of a house instance, HouseSerializer demands the house’s corresponding country instance to compute the serializer’s country field. As this country data is absent from the initial query set, Django initiates an additional request to fetch it. This process repeats for every single house in the query set—a staggering 50,000 times in total.
Fortunately, the solution is remarkably simple. To extract all the data required for serialization in one go, we can leverage the select_related() method on the query set. Consequently, our get_queryset method transforms into:
| |
Let’s examine the impact of this change on performance:
200 GET
/api/v1/houses/
35979ms overall
102ms on queries
4 queries
The overall response time plummets to a mere 36 seconds, with database interactions now taking a minuscule ~100ms and only 4 queries executed! This represents a significant improvement, but we can push the boundaries even further.
1.2 Specifying Data Needs: The Power of Targeted Retrieval
By default, Django retrieves all fields from the database. However, when dealing with large tables containing numerous columns and rows, it’s prudent to explicitly instruct Django on the specific fields to extract. This prevents wasted effort in retrieving information that won’t be utilized. In our case, we require only five fields for serialization, while our table boasts 17. Therefore, it makes sense to pinpoint the exact fields for retrieval, further reducing response time.
Django provides the defer() and only() query set methods precisely for this purpose. The former specifies fields to exclude from retrieval, while the latter dictates the fields to retrieve exclusively.
| |
This optimization effectively halves the time spent on queries, which is commendable. However, a mere 50ms is hardly a significant bottleneck. While the overall time also experiences a slight reduction, there’s still substantial room for improvement.
200 GET
/api/v1/houses/
33111ms overall
52ms on queries
4 queries
2. Optimizing Code: Delving into Business Logic
Database query optimization has its limits, as evidenced by our last result. Even if we hypothetically eliminated query time altogether, we’d still be left with an unacceptable 30-second wait for a response. It’s time to shift our focus to another level of optimization: business logic.
2.1 Simplifying Code: The Beauty of Concision
Third-party packages, while often powerful, can introduce unnecessary overhead for simple tasks. Our current task of returning serialized house instances exemplifies this.
Django REST Framework is undeniably versatile, offering a plethora of useful features out of the box. However, our primary objective now is to minimize response time, making it a prime candidate for optimization, particularly since the serialized objects are relatively straightforward.
Let’s craft a custom serializer to achieve this. For the sake of simplicity, we’ll define a single static method to handle the serialization. In a real-world scenario, you might opt for similar class and method signatures to maintain interchangeability with Django REST Framework serializers:
| |
200 GET
/api/v1/houses/
17312ms overall
38ms on queries
4 queries
The results speak for themselves. By circumventing the complexities of Django REST Framework serializers, we’ve effectively halved the response time.
Another noteworthy improvement is the reduction in the total number of function calls made during the request/response cycle. This figure drops from a staggering 15,859,427 calls (observed in section 1.2) to a more manageable 9,257,469 calls. This highlights that approximately one-third of all function calls were attributed to Django REST Framework.
2.2 Updating/Substituting Third-Party Packages: Staying Ahead of the Curve
The optimization techniques discussed thus far represent the more common, low-hanging fruit—those achievable without extensive analysis. However, a 17-second response time remains far from ideal. To further chip away at this number, we need to delve deeper into our code and scrutinize its inner workings. In other words, it’s time for some code profiling.
You can choose to perform profiling manually using Python’s built-in profiler or leverage third-party packages that utilize this profiler under the hood. Since we’re already employing silk, we can tap into its code profiling capabilities to generate a binary profile file, which can be visualized for insights. Numerous visualization packages can transform this binary profile into meaningful representations. For our purposes, we’ll be utilizing the snakeviz package.
Let’s examine the visualization of the binary profile generated from our last request, focusing on the view’s dispatch method:
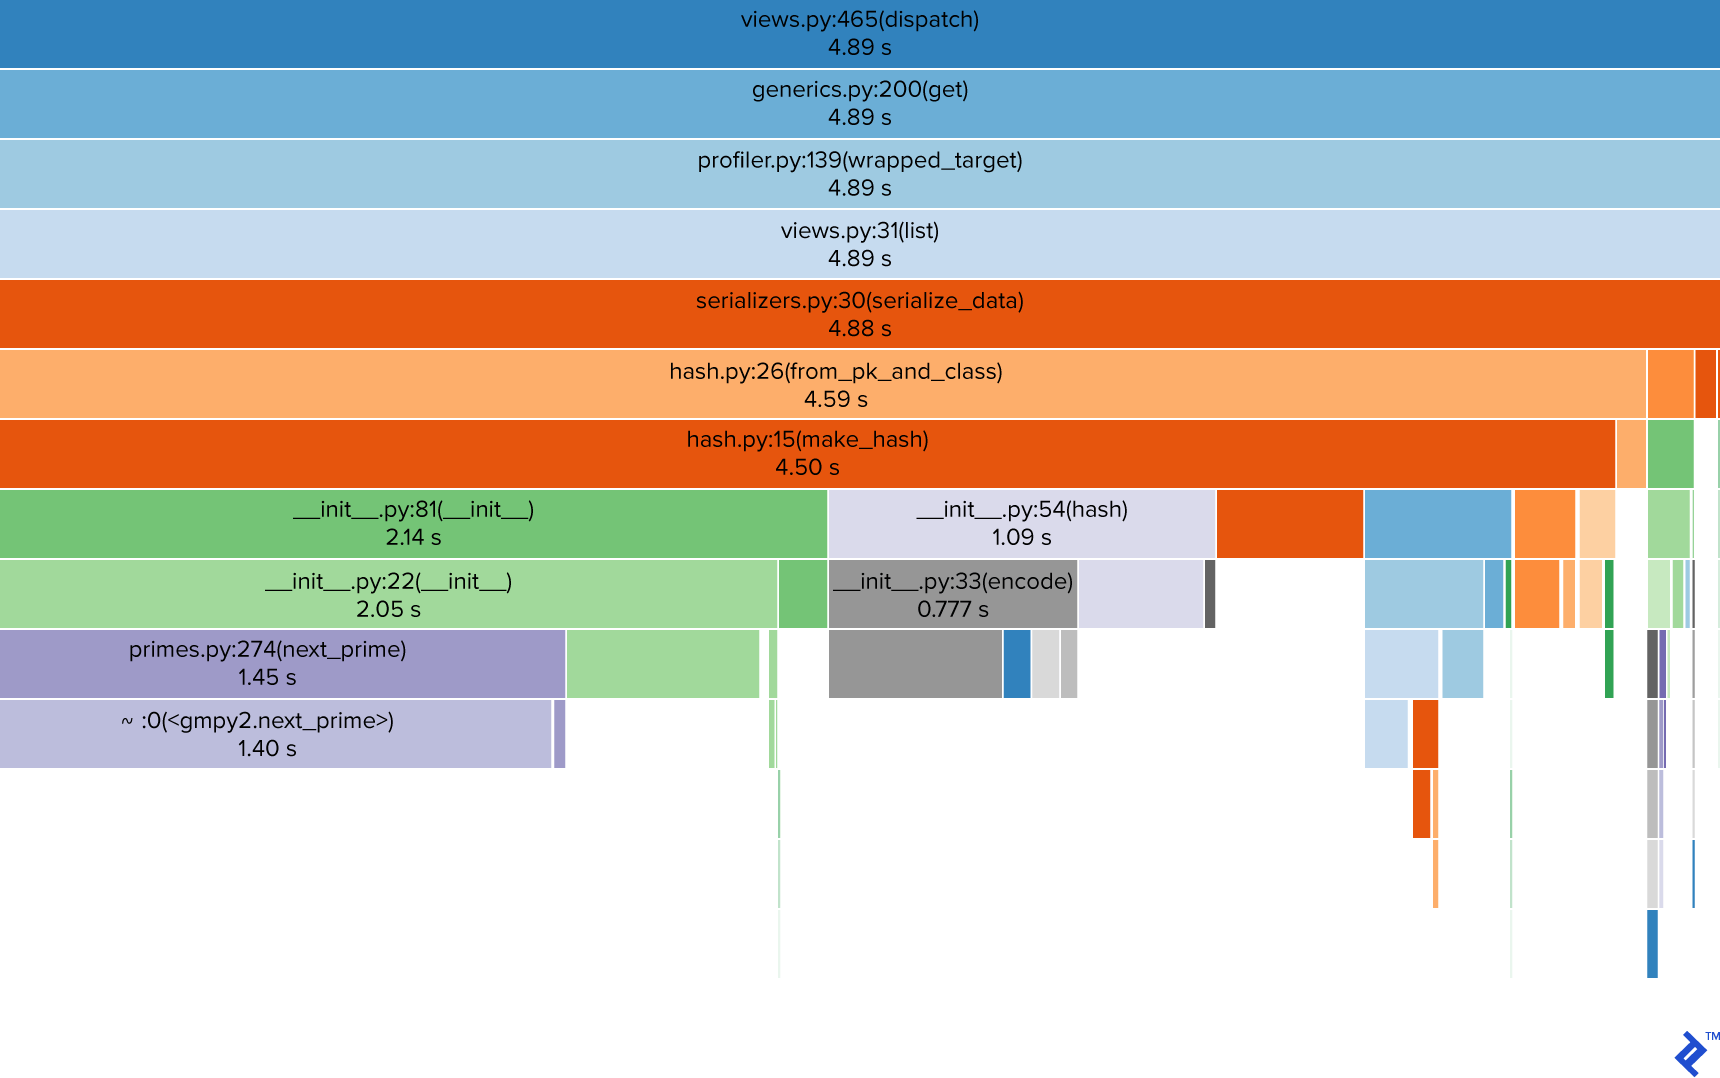
The call stack, presented from top to bottom, reveals the file name, method/function name along with its line number, and the corresponding cumulative time spent within that method. The visualization clearly highlights hash computation (represented by the violet rectangles for __init__.py and primes.py) as the primary time sink.
This hash computation, while currently the main performance bottleneck, isn’t technically our code; it originates from a third-party package.
In such situations, our options are somewhat limited:
- Check for an updated version of the package, hopefully boasting performance enhancements.
- Seek out alternative packages that excel in the specific tasks we require.
- Develop our own implementation, potentially surpassing the performance of the existing package.
Fortunately, a newer version of the basehash package, responsible for hashing, is available. Our code currently utilizes v.2.1.0, while v.3.0.4 awaits. Such scenarios, where a simple version upgrade is feasible, are more common in existing projects.
Examining the release notes for basehash v.3, a particular sentence piques our interest:
A massive overhaul was done with the primality algorithms. Including (sic) support for gmpy2 if it available (sic) on the system for that much more of an increase.
Let’s put this to the test!
| |
200 GET
/api/v1/houses/
7738ms overall
59ms on queries
4 queries
The results are impressive. We’ve managed to reduce the response time from 17 seconds to under 8 seconds. While this is a significant accomplishment, there’s one more area worth investigating.
2.3 Refactoring Existing Code: Unearthing Hidden Potential
So far, we’ve optimized our queries, replaced complex and generic third-party code with tailored functions, and updated external packages. However, we haven’t touched our own codebase. Sometimes, a little refactoring can yield surprising performance gains. To identify such opportunities, we turn to our profiling results once more.
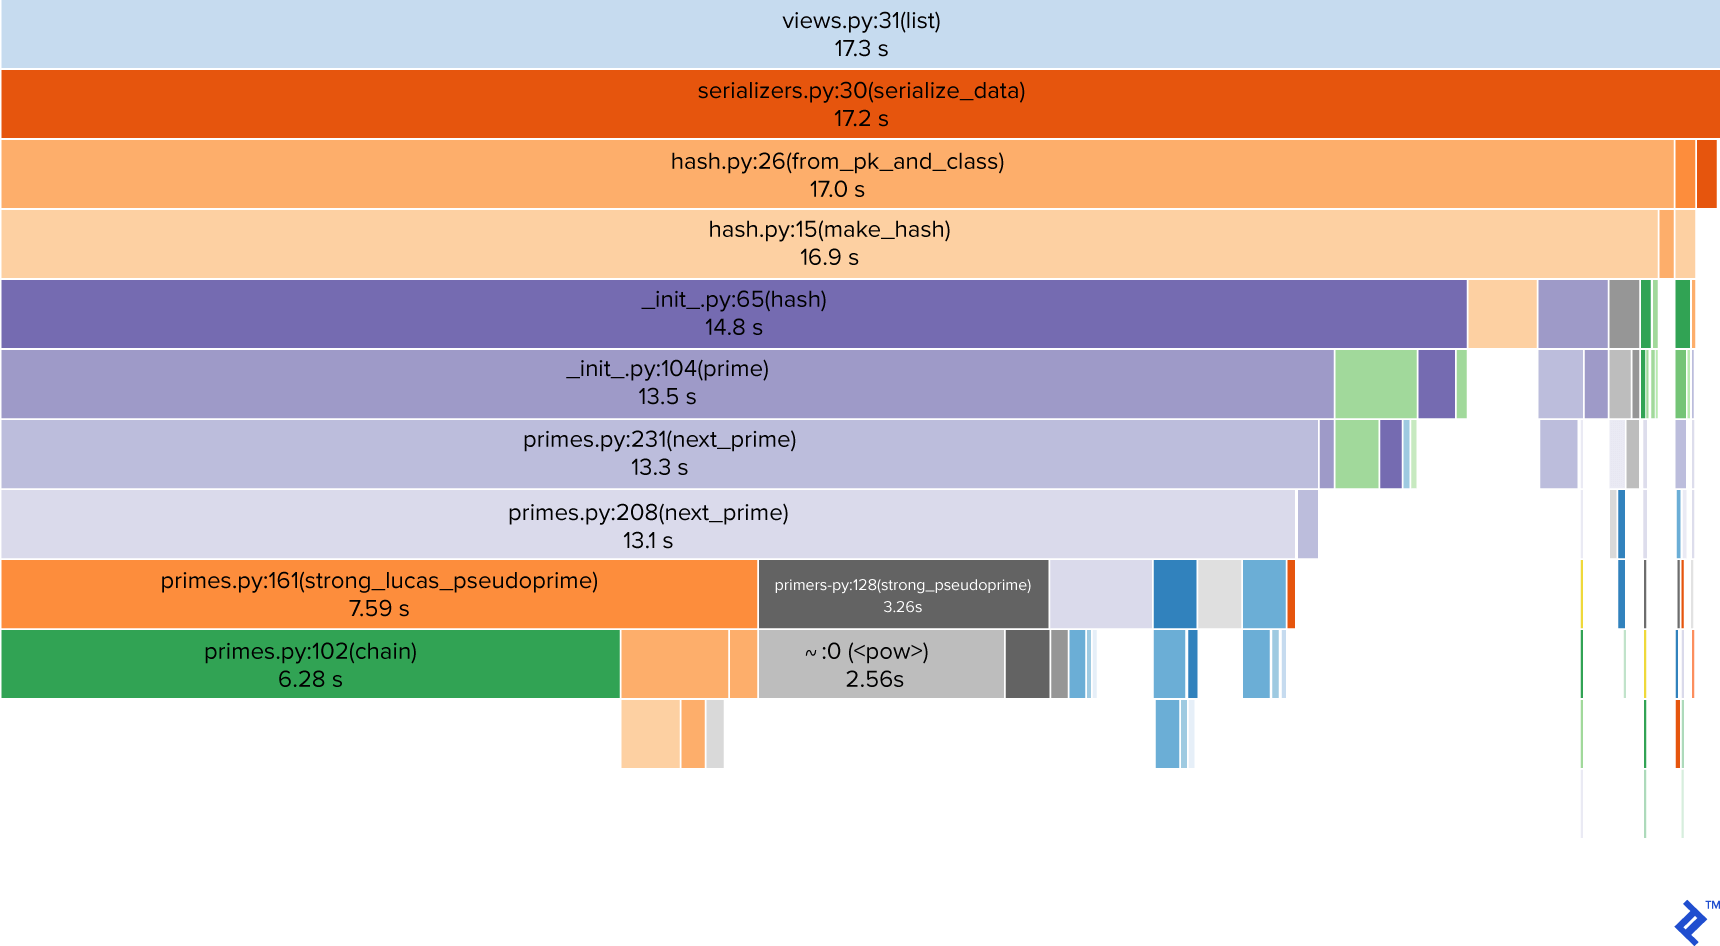
A closer look reveals that hashing remains a concern (unsurprising, given it’s our primary data operation), although we’ve made progress in that area. However, the greenish rectangle indicating 2.14 seconds spent in __init__.py, along with the grayish __init__.py:54(hash) right below it, raise a red flag. It seems some initialization process is taking longer than it should.
Let’s revisit the source code of the basehash package.
| |
The code reveals that initializing a base instance necessitates a call to the next_prime function, which, as our visualization confirms, is a computationally expensive operation.
Now, let’s reexamine my Hash class:
| |
Notice the two methods labeled for their repeated initialization of a base36 instance upon each call. This redundancy is unnecessary.
Since hashing is a deterministic process, meaning the same input always produces the same output, we can safely store the base36 instance as a class attribute without risking any adverse effects. Let’s see how this optimization fares:
| |
200 GET
/api/v1/houses/
3766ms overall
38ms on queries
4 queries
We’ve achieved an impressive final result of under four seconds—a far cry from our starting point. While caching presents another avenue for response time optimization, we’ll reserve that for another discussion.
Conclusion
Performance optimization is an iterative journey of analysis and discovery. No hard and fast rules apply universally, as every project exhibits unique workflows and bottlenecks. However, code profiling should always be your first step. If such a concise example allowed us to shave off a remarkable 69 seconds from the response time, imagine the optimization potential lurking within large-scale projects.