It’s safe to say that logs are often overlooked and underused by freelance PHP developers. While they provide a treasure trove of information, developers often turn to logs as a last resort for troubleshooting.
In reality, PHP log files should often be the first line of investigation when issues arise. The information they hold can dramatically reduce the time spent deciphering a tricky bug.
Perhaps more crucially, with some ingenuity and planning, your log files can transform into a valuable repository of usage data and analytics. By creatively using log files, you can uncover answers to questions like: Which browsers are most frequently used to access my site? What’s the typical server response time? What’s the proportion of requests directed at the site’s root directory? How has usage evolved since the latest updates were rolled out? And so much more.
This article presents a collection of tips on setting up your log files, as well as interpreting the data they contain, to unlock their full potential.
Although this article technically focuses on logging for PHP developers, a large portion of the information presented here is relatively platform-independent and applies to other programming languages and technology stacks as well.
Note: This article assumes a basic understanding of the Unix shell. For those who need a refresher, an Appendix is included to introduce some essential commands for accessing and viewing log files within a Unix environment.
Our PHP Log File Example Project
For the purpose of illustration in this article, we will use Symfony Standard as our working project, and we will deploy it on Debian 7 Wheezy using rsyslogd, nginx, and PHP-FPM.
| |
This quickly sets up a functional test project with an appealing user interface.
Tips for Setting Up Your Log Files
Here are some suggestions on configuring your log files to maximize their usefulness.
Error Log Setup
Error logs represent the most fundamental type of logging; capturing extra details and information when something goes wrong. Ideally, you would strive for a world with zero errors, resulting in empty error logs. However, when issues inevitably surface, your error logs should be one of your initial points of reference during debugging.
Setting up error logs is generally a straightforward process.
For instance, all error and crash notifications can be logged in the error log using the exact format that would otherwise be displayed to a user. With a few simple configuration tweaks, the end-user will never encounter those unsightly error messages on your site, while DevOps teams can still keep tabs on the system and analyze these error messages in their entirety. Here’s how to implement this type of logging in PHP:
| |
Two more lines worth incorporating into your log file for a live site, preventing detailed error information from reaching your users, are:
| |
System Log (syslog) Setup
There are numerous generally compatible implementations of the syslog daemon in the open-source world, including:
syslogdandsysklogd– frequently found on BSD family systems, CentOS, Mac OS X, and otherssyslog-ng– the default for contemporary Gentoo and SuSE buildsrsyslogd– widely employed on the Debian and Fedora families of operating systems
(Note: For the examples in this article, we’ll be working with rsyslogd.)
The standard syslog configuration is typically sufficient for capturing your log messages in a system-wide log file (commonly /var/log/syslog; it might also be /var/log/messages or /var/log/system.log depending on your specific Linux distribution).
The system log offers various logging facilities, eight of which (LOG_LOCAL0 through LOG_LOCAL7) are reserved for custom projects. Here’s an example of setting up LOG_LOCAL0 to write to 4 separate log files, categorized by logging level (i.e., error, warning, info, debug):
| |
With this setup, whenever a log message is written to the LOG_LOCAL0 facility, error messages will be directed to /var/log/my/err.log, warnings to /var/log/my/warning.log, and so forth. It’s important to note that the syslog daemon filters messages for each file based on a “this level and higher” rule. So, in the example above, all errors will show up in all four configured files, warnings will appear in all but the error log, informational messages will be found in the info and debug logs, and debug messages will only go to debug.log.
Another crucial point: The - symbols preceding the info and debug level files in the configuration file example above indicate that writes to those files should be handled asynchronously (as these operations are non-blocking). This is generally acceptable (and even advisable in most scenarios) for info and debug logs. However, it’s best to ensure that writes to the error log (and likely the warning log as well) are synchronous.
To disable a less critical logging level (e.g., on a production server), you can simply redirect related messages to /dev/null (effectively discarding them):
| |
One specific customization that proves useful, particularly for supporting some of the PHP log file parsing we’ll discuss later, is to utilize tabs as delimiters within log messages. This can be easily accomplished by adding the following file to /etc/rsyslog.d:
| |
Lastly, remember to restart the syslog daemon after making any configuration changes to ensure they take effect:
| |
Server Log Setup
In contrast to application logs and error logs that you can write to directly, server logs are written solely by their respective server daemons (e.g., web server, database server, etc.) for each request. Your only “control” over these logs lies in configuring the logging behavior permitted by the server itself. While these files can contain a significant amount of information to sift through, they are often the only avenue to gain a clear understanding of what’s happening “behind the scenes” on your server.
Let’s deploy our example Symfony Standard application within an nginx environment using MySQL as the backend storage. Here’s the nginx host configuration we’ll employ:
| |
Let’s focus on the last two directives: access_log handles general request logging, while error_log is designated for errors. As with application error logs, it’s prudent to establish additional monitoring to receive alerts about problems, allowing you to respond promptly.
Note: This is an intentionally simplified nginx configuration file for demonstration purposes only. It disregards security and performance considerations and shouldn’t be used as-is in any “real-world” environment.
Here’s what we observe in /var/log/nginx/my_access.log after entering http://my.log-sandbox/app_dev.php/ in a browser and pressing Enter.
| |
This reveals that serving a single page involves the browser making 9 HTTP calls. It’s worth noting that 7 of these are requests for static content, which are generally small and straightforward. However, they still consume network resources, which is an area that can be optimized through various sprites and minification strategies.
While we’ll delve into these optimizations in another article, the key takeaway here is that we can log requests for static content separately using another location directive:
| |
Keep in mind that nginx’s location directive uses simple regular expression matching, so you can include as many static content extensions as your site uses.
Parsing these logs follows the same principles as parsing application logs.
Other Noteworthy Logs
Two additional PHP logs worth mentioning are the debug log and data storage logs.
The Debug Log
Another handy feature of nginx logs is the debug log. We can enable it by modifying the error_log line in the configuration as follows (this requires the nginx debug module to be installed):
| |
The same approach applies to Apache or any other web server you might be using.
Incidentally, debug logs are not related to error logs, despite being configured within the error_log directive.
While debug logs can be quite verbose (a single nginx request, for example, generated 127KB of log data!), they can still provide valuable insights. Navigating through a large log file might seem daunting, but it can often reveal clues and information that significantly speed up the debugging process.
In particular, the debug log can be immensely helpful for debugging nginx configurations, especially the more intricate aspects like location matching and rewrite chains.
It’s crucial to emphasize that debug logs should never be enabled in a production environment. Their storage requirements and the volume of information they capture translate into significant I/O load on your server, which can severely impact overall system performance.
Data Storage Logs
Data storage logs represent another category of server logs that can be beneficial for debugging purposes. In MySQL, you can activate them by adding these lines to your configuration:
| |
These logs provide a chronological record of queries executed by the system while processing database requests, which can prove helpful for various debugging and tracing tasks. However, they should not be left enabled in production environments due to the additional and unnecessary I/O load they generate, negatively impacting performance.
Writing to Your Log Files
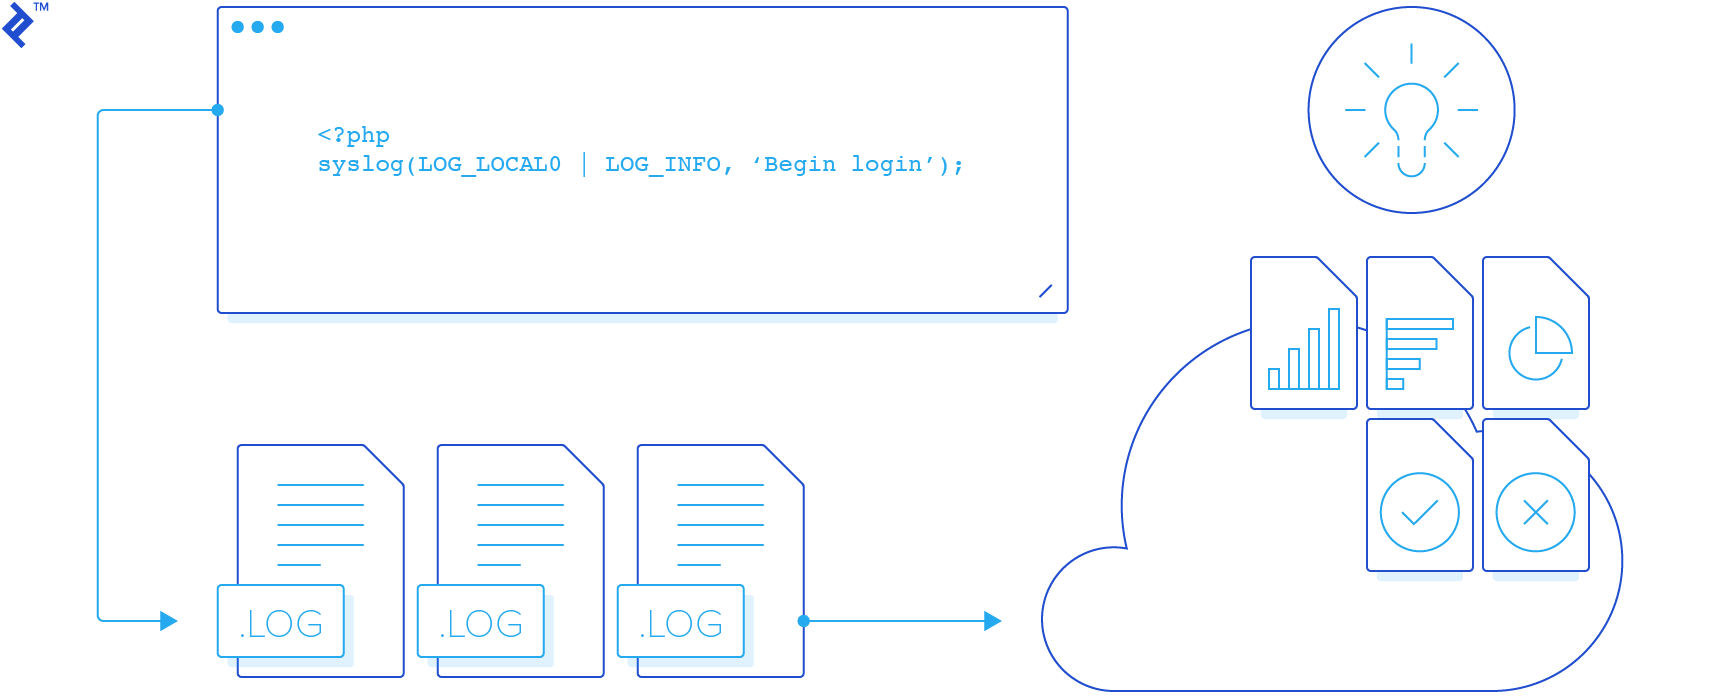
PHP itself provides functions for opening, writing to, and closing log files (openlog(), syslog(), and closelog(), respectively).
There are also several helpful numerous logging libraries available to PHP developers, such as Monolog (popular among Symfony and Laravel users), along with various framework-specific implementations, such as the logging features integrated into CakePHP. Typically, libraries like Monolog not only encapsulate syslog() calls but also allow for the use of alternative backend functionality and tools.
Here’s a straightforward example illustrating how to write to the log:
| |
Let’s break down our call to openlog:
- It configures PHP to prepend a unique identifier to each system log message generated during the script’s execution.
- It delays the establishment of the syslog connection until the first
syslog()call is made. - It designates
LOG_LOCAL0as the default logging facility.
After executing the code above, here’s what the contents of the log file would resemble:
| |
Extracting Maximum Value from Your PHP Log Files
Having covered the theory and fundamentals, let’s explore how much we can glean from logs by making minimal changes to our sample Symfony Standard project.
To begin, we’ll create two scripts: src/log-begin.php (to properly initialize and configure our logs) and src/log-end.php (to log information upon successful completion). For the sake of simplicity, we’ll direct all messages to the info log.
| |
Next, let’s include these scripts in app.php:
| |
For our development environment, we’ll also want to include these scripts in app_dev.php. The code would be identical to the above, with the exception of setting MODE to DEV instead of PROD.
Additionally, we’d like to track which controllers are being invoked. To do this, let’s add a line to Acme\DemoBundle\EventListener\ControllerListener, right at the beginning of the ControllerListener::onKernelController() method:
| |
It’s worth noting that these modifications involve a mere 15 extra lines of code but can collectively provide a wealth of information.
Analyzing the Data within Your Log Files
Let’s start by determining how many HTTP requests are involved in serving each page load.
Based on our current logging configuration, here’s the information logged for a single request:
| |
This reveals that each page load is actually handled by two HTTP requests.
Two points deserve attention here. First, the two requests per page load are specific to using Symfony in development mode (which has been used throughout this article). You can identify development mode calls by looking for /app-dev.php/ segments in the URLs. Second, even though each page load involves two sequential requests to the Symfony app, remember that we observed more HTTP calls earlier in the nginx access logs, some of which were for static content.
Now, let’s navigate around the demo site a bit (to populate our log files) and see what other insights we can extract.
What’s the total number of requests served since the log file was created?
| |
Did any of these requests fail (did the script terminate prematurely)?
| |
We can see that the number of BEGIN and END records match, indicating that all calls completed successfully. If a PHP script had encountered an error and failed to complete, it wouldn’t have reached the execution of the src/log-end.php script.
What percentage of requests were directed at the site’s root directory?
| |
This tells us there were two instances of the site’s root page being loaded. Since we previously established that (a) each page load results in two requests to the app and (b) there were a total of 10 HTTP requests, we can conclude that 40% of requests were for the site’s root (i.e., 2x2/10).
Which controller class is responsible for handling requests to the site root?
| |
Here, we used the unique identifier associated with a request to examine all log messages related to that specific request. This allowed us to determine that the controller class responsible for serving requests to the site root is Acme\DemoBundle\Controller\WelcomeController.
Which clients with IPs within the
192.168.0.0/16subnet have accessed the site?
| |
As anticipated in this straightforward test case, only my local computer has accessed the site. While this is an elementary example, it highlights the powerful capability of analyzing the sources of traffic to your site.
What proportion of traffic to my site originated from Firefox?
Given that 1b101cd represents the hash of my Firefox User-Agent, we can answer this question as follows:
| |
Answer: 80% (i.e., 8/10)
What percentage of requests resulted in a slow response?
For this example, let’s define “slow” as a response time exceeding 5 seconds. Therefore:
| |
Answer: 20% (i.e., 2/10)
Did any users submit GET parameters?
| |
No. The standard Symfony implementation relies solely on URL slugs. In this case, this also suggests that no attempts have been made to compromise the site’s security.
These are just a few basic illustrations of how log files can be creatively used to derive valuable usage insights and even rudimentary analytics.
Additional Considerations
Prioritizing Security
A word of caution regarding security. While logging requests often makes sense, it’s paramount to exercise extreme caution and remove any potentially sensitive user information before storing it in the log.
Combating Log File Bloat
As log files are text files that are constantly appended to, they inherently grow over time. Since this is a well-known issue, there are some standard techniques to manage log file size.
The simplest method is log rotation. Log rotation involves:
- Regularly creating a new, empty log file and using it for subsequent writes, while archiving the old log file for historical purposes.
- Removing sufficiently “aged” log files to free up disk space.
- Ensuring uninterrupted application logging during these file operations.
A common solution for this is logrotate, a utility included by default in most Linux distributions. Here’s a basic configuration file for rotating our logs:
| |
A more advanced approach involves configuring rsyslogd to write messages to files that are dynamically created based on the current date and time. While this would still necessitate a custom solution for purging older files, it empowers DevOps teams with fine-grained control over log file retention periods. For our example:
| |
This configuration instructs rsyslog to create a separate log file every hour, eliminating the need for rotation and daemon restarts. To complement this, here’s how we can remove log files older than 5 days:
| |
Remote Logging
As projects expand, parsing log information becomes increasingly resource-intensive. This not only adds to your server’s workload but can also create spikes in CPU and disk I/O when logs are parsed, potentially degrading server response times for users (or even causing downtime in extreme cases).
To mitigate this, consider implementing a centralized logging server. This simply requires another server with UDP port 514 (the default syslog port) open. To enable rsyslogd to listen for incoming connections, add the following line to its configuration file:
| |
Once this is set up, configuring the client is straightforward:
| |
(where HOSTNAME represents the hostname of your remote logging server).
Conclusion
This article has showcased some creative ways to extract significantly more value from your log files than you might have previously imagined. However, it’s important to remember that we’ve only scratched the surface of what’s possible. The extent, scope, and format of what you can log are virtually limitless. This means that if you have specific usage or analytics data you want to derive from your logs, you simply need to log it in a way that facilitates easy parsing and analysis. Furthermore, this analysis can often be performed using standard Linux command-line tools like grep, sed, or awk.
In conclusion, PHP log files are an incredibly powerful tool with the potential to be immensely beneficial.
Resources
Code on GitHub: https://github.com/isanosyan/toptal-blog-logs-post-example
Appendix: Accessing and Working with Log Files in the Unix Shell
Here’s a brief introduction to some commonly used Unix command-line utilities for reading and manipulating log files.
catis perhaps the simplest. It displays the entire contents of a file to the standard output stream. For instance, the following command will print the contents oflogfile1to the console:1cat logfile1The
>symbol allows you to redirect output, such as to another file. It opens the target stream in write mode, which means the target’s contents will be overwritten. Here’s how to replace the contents oftmpfilewith the contents oflogfile1:1cat logfile1 > tmpfile>>redirects output and opens the target stream in append mode. The existing content of the target file is preserved, and new lines are added at the end. This will append the contents oflogfile1totmpfile:1cat logfile1 >> tmpfilegrepfilters a file based on a specified pattern, printing only matching lines. The following command will print only the lines inlogfile1that contain the message “Bingo”:1grep Bingo logfile1cutprints the contents of a single column, identified by its number starting from 1. By default, it treats tab characters as delimiters between columns. For example, if you have a file containing timestamps in the formatYYYY-MM-DD HH:MM:SS, you can usecutto extract only the year:1cut -d"-" -f1 logfile1headdisplays only the first few lines of a file.taildisplays only the last few lines of a file.sortsorts the lines of the input.uniqremoves consecutive duplicate lines from the input.wccounts the number of words in a file. When used with the-lflag, it counts lines instead.The pipe symbol (
|) sends the output of one command to the input of the next. Pipes are very useful for chaining commands together. For instance, here’s how to find the distinct months of 2014 that appear within a set of timestamps:1grep -E "^2014" logfile1 | cut -d"-" -f2 | sort | uniq
In this example, we first use grep to match lines containing “2014”, then use cut to extract the month. Finally, we combine sort and uniq to print each distinct month only once.