It’s common to feel the urge to immediately start building an app when inspiration hits. However, while enthusiasm is fantastic, app development costs can be high, and many apps don’t achieve success. Therefore, before diving into the building process, it’s crucial to formulate a plan for profitability.
This mobile analytics tutorial is designed for those with app ideas or existing products on the App Store. It explores leveraging key metrics to ensure your app generates more revenue than its development cost.
Is Your Mobile App Profitable?
Let’s start with a quick knowledge check. Answer this question before proceeding, as the answer is revealed in the next section.
How Many Consumer-facing Apps Make a Profit?
It’s unfortunate, but over 99.9 percent of mobile applications that appear on the App Store cost more to make than they ever receive back in App Store revenue. Is it even worth trying? Why is this number so high?
In my opinion, the answer is that the vast majority of apps that are released on the App Store are done incorrectly. They focus on building a very large feature set and use the mentality if we build it, they will come. While that worked in the 1980s, it does not work on a mobile application.
There’s simply too many to choose from. If you want your app to be successful, you need to be able to acquire a user for cheaper than their lifetime value. User acquisition is a fine art, and there are several great books on the subject—so today, we’re going to talk about using mobile analytics best practices to define the success of your application.
Minimum Viable Product: Start Small
Often, people envision their mobile app as a comprehensive solution addressing numerous problems for their target audience. However, trying to incorporate every feature from the get-go is a recipe for failure. For those unfamiliar with the concept of a Minimum Viable Product (MVP), I strongly recommend reading The Lean Startup.
While a detailed discussion about MVPs is beyond this article’s scope, let’s assume we aim to launch with 10 percent of your envisioned product. Instead of trying to solve multiple user problems, focus on effectively solving just one. Validate your solution by formulating assumptions and then using mobile analytics to test them.
Choosing the Right Mobile Analytics Tools
Numerous application analytics platforms are available, each with advantages and disadvantages. My top recommendation is Segment.com. It comprehensively collects all necessary data and can even forward it to a different provider if you prefer their interface or features. However, it becomes a paid service once your app surpasses 1,000 monthly active users (MAUs).
If you’re looking for free options, consider exploring Flurry, Google/Firebase Analytics, or Heap. Integrating mobile analytics tracking platforms is typically cost-effective from a development standpoint, often achievable within minutes. Therefore, don’t hesitate to integrate multiple platforms if you’re uncertain about the best fit.
Essential Mobile App Metrics to Track
The world of analytics offers hundreds of potential metrics to track. So, where should you begin?
While the specific metrics may vary depending on the app, I’ll focus on a consumer-facing example in this series: a mobile game. Although the example centers around a game, the metrics discussed are broadly applicable to almost any app.
Note: The upcoming part of the series will feature a different app with a specific objective and explore relevant metrics for that scenario.
Example App: An Engaging Puzzle Game
A few years ago, I developed a mobile game that was well-received initially. It had a successful launch and achieved downloads at a reasonable cost, but ultimately, it failed to generate profit. Let’s delve into the reasons by analyzing three key mobile metrics: Day 1 retention, ARPDAU, and LTV.
Understanding Day 1 Retention
Day 1 retention, in the context of product development, answers the following question: Out of 100 users who install my app, how many return to it one day later?
Day 1 retention is a valuable metric to focus on for many consumer-facing apps due to three primary reasons:
- Easy Measurement and Visibility: Within 24 hours of being live on the App Store, you have a baseline understanding of your app’s “stickiness.”
- Estimating User Engagement and Revenue: Day 1 retention rate can help you estimate the average user lifespan within your app. Combined with one other metric, you can project the revenue generated per user download.
- Industry Standard: It allows you to benchmark your app’s performance against competitors in the same App Store category.
This leads us to our next question:
What Constitutes a Good Day 1 Retention Rate?
While an 80-percent Day 1 retention rate would be amazing, it’s simply unheard of. Users fall off of games and apps very quickly, and more than 50 percent of app installs are only opened one time.
There’s a great rule in retention terms called the 40/20/10 rule. It means that if 100 users download your app and 40 come back the next day, about 20 of them will be there one week later, and 10 will be there one month later. If you can create an app that hits 40 percent Day 1 retention, that’s considered a very good app!
For iOS apps, App Store Connect (the platform for publishing your app) automatically monitors retention, providing this data without any extra effort! For Android apps, you can use any of the aforementioned tools to obtain your retention metrics.
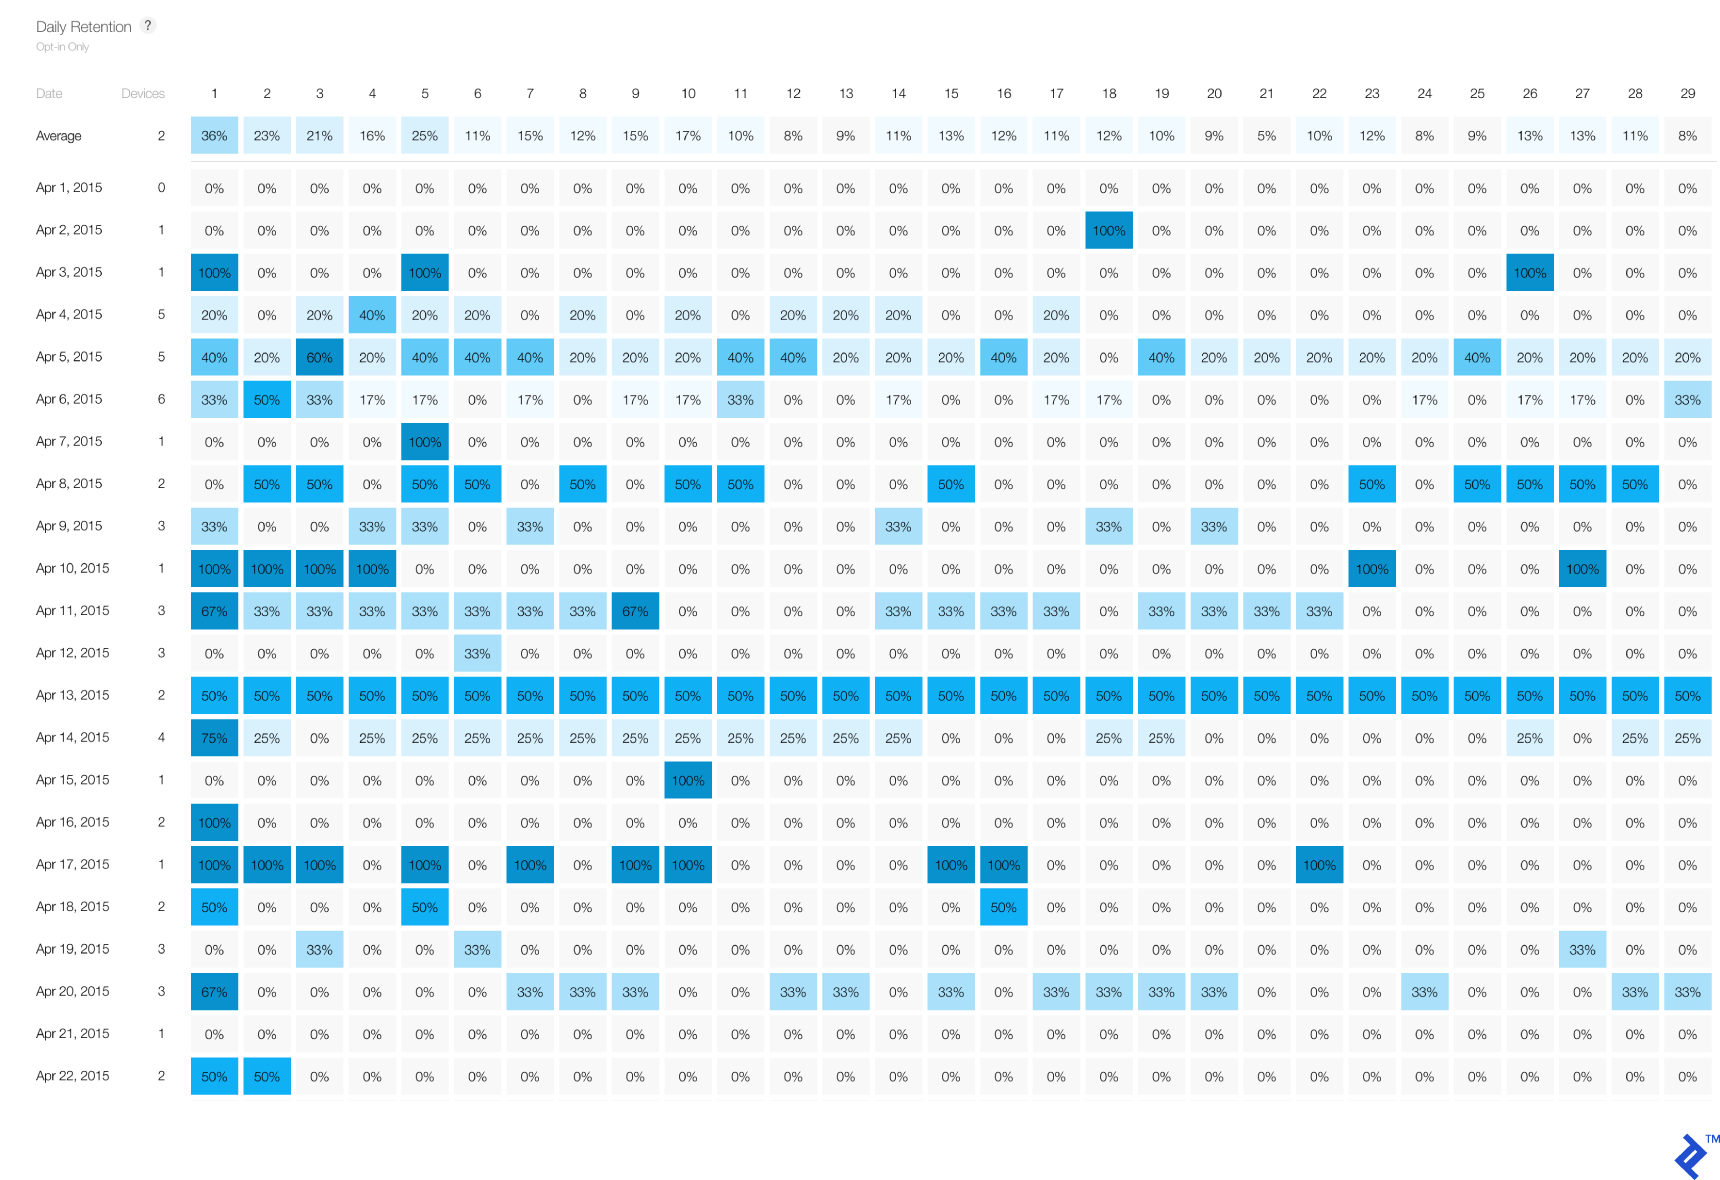
Our example game achieved a 37 percent Day 1 retention rate, which closely aligns with our 40 percent target—a positive sign! To learn more about enhancing retention and other mentioned metrics, stay tuned for my next blog post.
Average Revenue per Daily Active User (ARPDAU)
Now that we have an app demonstrating promising retention, let’s address the crucial aspect of monetization. Apps can generate revenue through various avenues. Free apps often leverage in-app purchases, advertisements, subscriptions, or services like Apple Pay for physical goods. Regardless of your chosen method, ARPDAU is a vital metric to track the revenue generated relative to the number of users engaging with your app.
ARPDAU is calculated by dividing the total revenue earned on a specific day by the number of unique users who used the app on that same day:
[\operatorname{ARPDAU} = \frac{\operatorname{Total\ Revenue\ per\ Day}}{\operatorname{Total\ Number\ of\ Daily\ Active\ Users}}]
Time for our final quiz question:
What is Candy Crush’s Estimated ARPDAU?
When it comes to ARPDAU, getting $0.05 is considered above average, and the top 15% of games earn around $0.15. Candy Crush became a top app on the App Store for two reasons: It had a fantastic retention combined with a killer ARPDAU. They knew that every user on average that opened up their app that day made them $0.13.
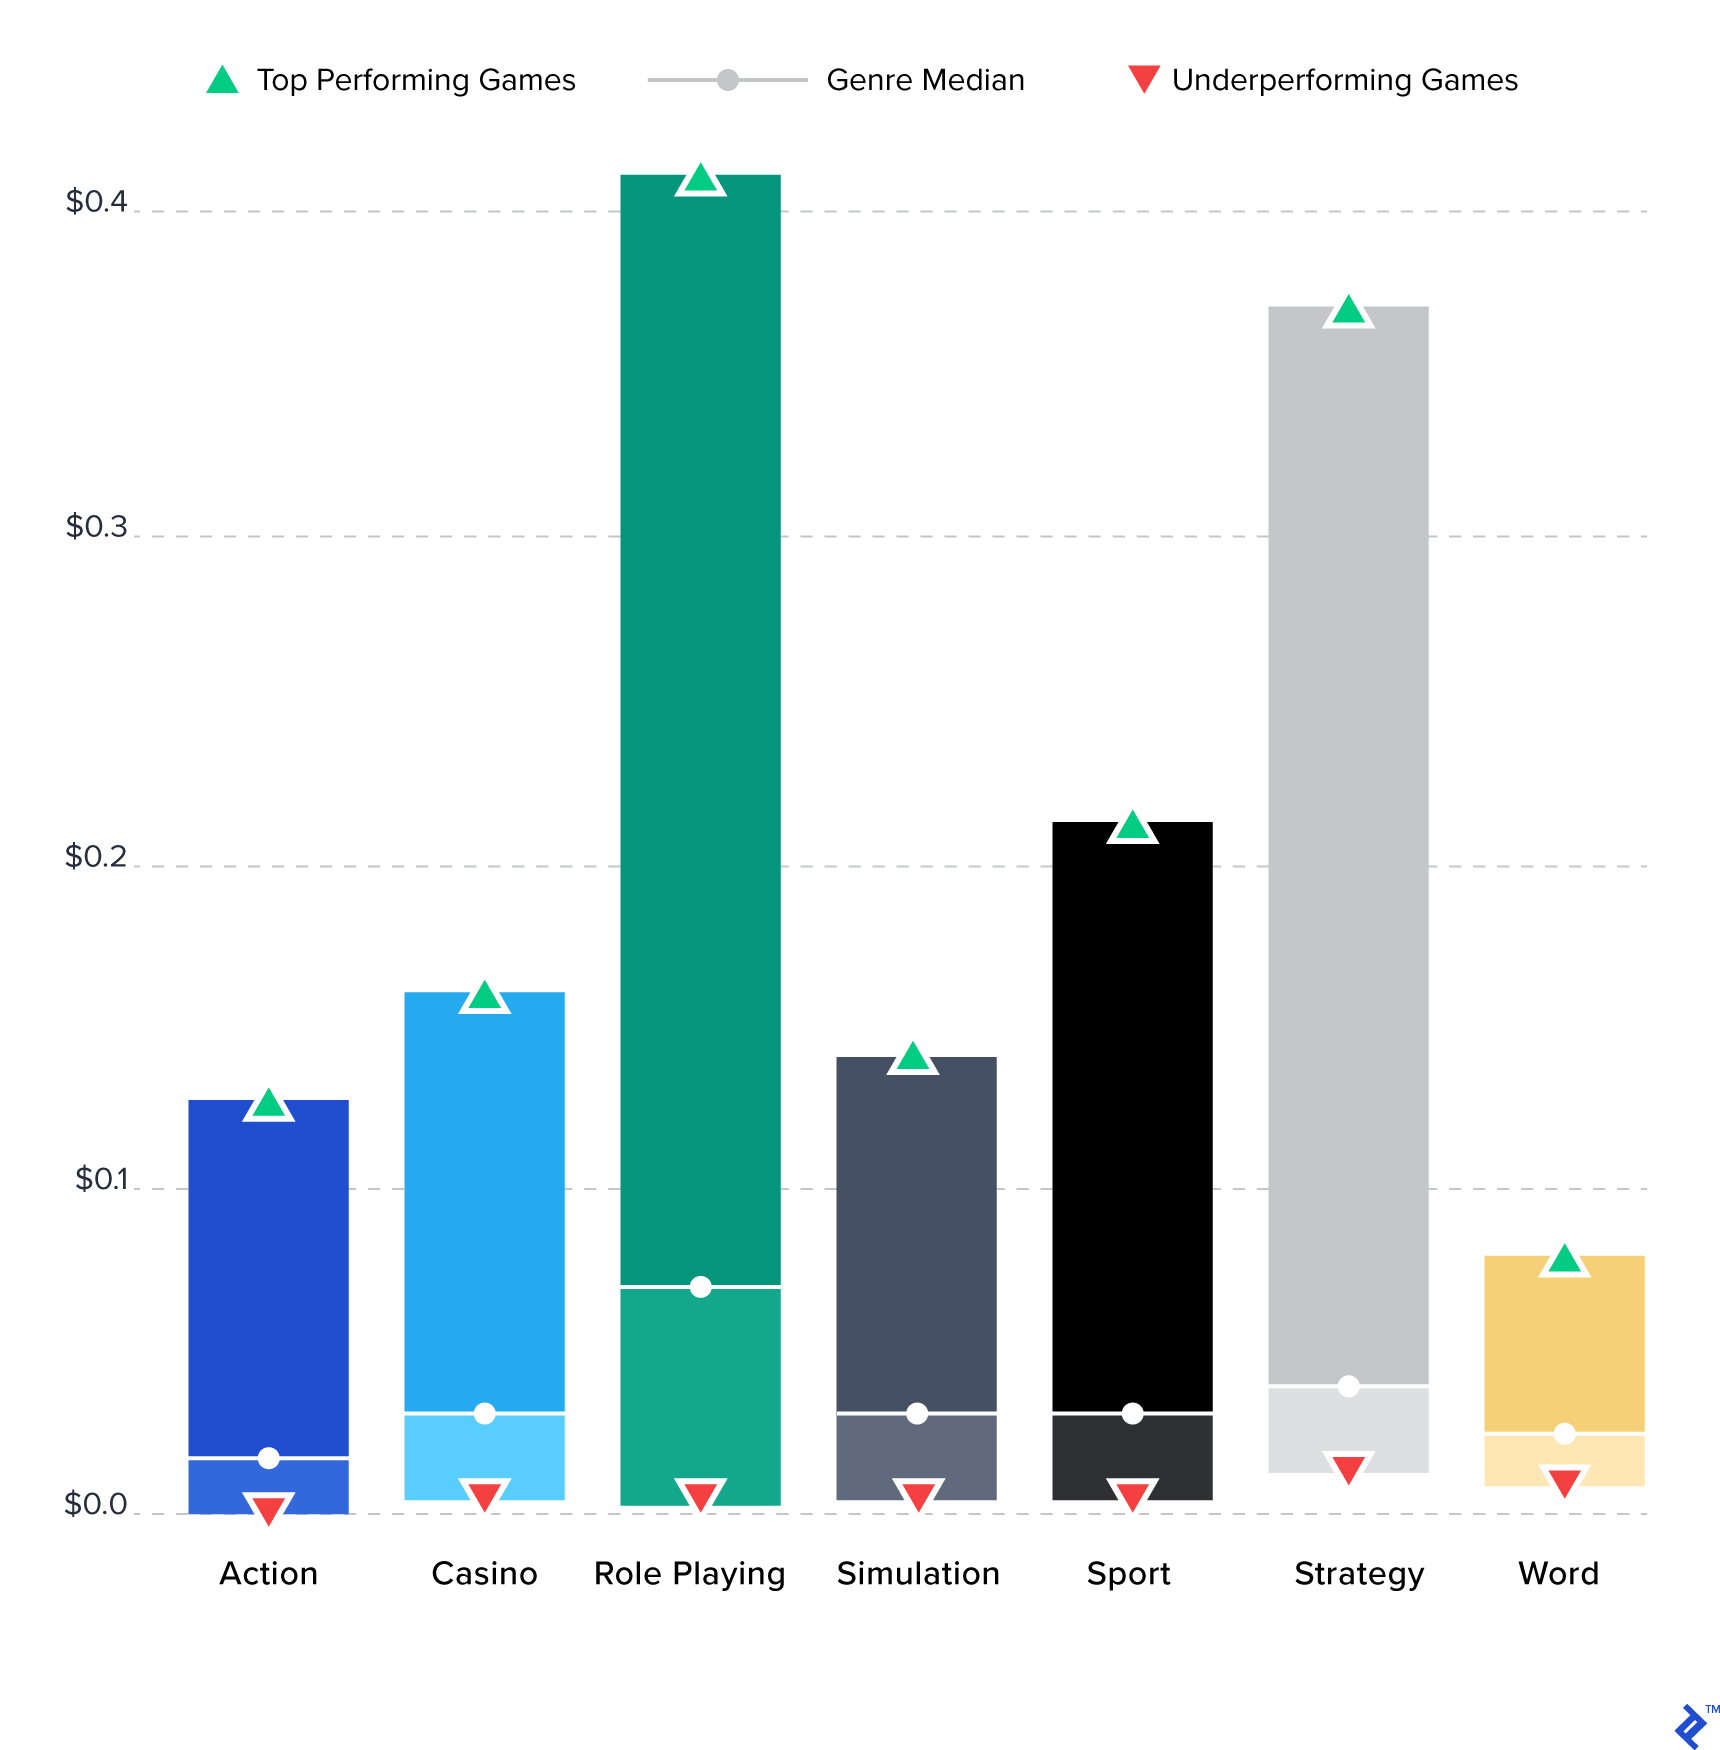
ARPDAU benchmarks can significantly differ based on your app’s genre. For instance, a high-performing word game might have an ARPDAU of $0.08, while a top-grossing role-playing game could reach $0.40. For optimal insights, research your app’s genre to determine relevant mobile app performance metrics. The PDF mentioned earlier provides a good starting point. To illustrate the varying revenue potential across genres, here’s a breakdown of average ARPDAUs:
ARPDAU is a valuable analytical tool because it remains consistent even as your user base fluctuates. Similar to Day 1 retention, you can establish a baseline ARPDAU within the first 24 hours of launching on the App Store. This allows you to quickly gauge the impact of implemented changes without waiting for weeks. In the case of our puzzle game, we launched with an ARPDAU of $0.02 but were able to increase it to $0.05 over time.
Determining User Lifetime Value (LTV)
Having established the user engagement frequency and the revenue generated per day, we can now combine these figures to calculate one of the most critical mobile app metrics: User Lifetime Value.
Thanks to the 40/20/10 rule, you can estimate a user’s average lifespan within your app based on your Day 1 retention rate. For example, a 40% Day 1 retention suggests an average user lifespan of 26.39 days.
Naturally, user lifespans will vary, but this calculation provides a reasonable average. It’s important to note that these figures can be influenced by your app’s genre. For instance, a fitness app might not be used daily or year-round like a game, and a commuting app will exhibit different usage patterns on weekends compared to weekdays. Our goal here is to obtain an approximate figure to assess whether we’re on the right track.
To determine user-days from Day 1 retention, you need to calculate the area under the curve of a survival function. Interestingly, the result is a linear function:
[\operatorname{User\ Lifetime} = \operatorname{Day\ 1\ Retention} \times 0.66]
To calculate the LTV of a user, multiply this result by your ARPDAU:
[\operatorname{LTV} = \operatorname{User\ Lifetime} \times \operatorname{ARPDAU}]
In our puzzle game example, a 37-percent Day 1 retention translates to a user lifetime of 24.41 days, resulting in an LTV of:
[24.41 \times $0.05 = $1.22]
Therefore, using just two metrics—both available within 24 hours of launching on the App Store—we can approximate a user’s LTV.
Evaluating Paid User Acquisition
Before analyzing these metrics, determining whether to invest in paid user acquisition can be challenging. Without knowing the potential return on investment (ROI) from a user, it’s difficult to set a budget for acquiring them. The cost of acquiring a single user download is referred to as cost per install (CPI). Your CPI can fluctuate significantly based on factors such as:
- Ad Platform: The platform you choose to display your ads on.
- Ad Format: Video, image, pop-up, etc.
- Ad Quality: The quality of your ad’s content.
- App Store Description: A compelling and informative app description can positively impact CPI.
If your app’s LTV surpasses its CPI, you have a profitable app!
Now, let’s revisit our puzzle game example and understand why it didn’t succeed. Both the Day 1 retention and ARPDAU metrics were encouraging. What went wrong?
Those two metrics alone didn’t tell the whole story: We had created an app with a Lifetime Value of $1.22 per user in the USA. Unfortunately, the cost per install in the USA is $2.07, and to be even more specific, the average CPI for a puzzle game is $4.54. This meant we were likely to lose $3.32 for every user acquired through paid advertising.
Determining a Statistically Significant Sample Size for LTV
Determining LTV and CPI involves a chicken-and-egg dilemma. If your app launch only garners 50 downloads, your sample size is too small to determine an accurate LTV, even if you can calculate it. A substantial number of downloads is crucial for these metrics to hold weight, necessitating an initial advertising investment to assess the viability of further investment.
When developing a mobile application, it’s essential to allocate resources for testing its viability. Successful projects often spend significantly more on advertising than development, so factor in marketing and testing costs during budgeting. As a general rule, aim for 1,000 downloads before drawing conclusions from your metrics. If you haven’t already, I highly recommend reading David Kadavy’s article about A/A testing.
An exception to this rule applies to apps reliant on a user network, such as social networks or dating apps. In these cases, the platform’s value increases with the number of users. You might need to invest in acquiring an initial user base to kickstart growth. Alternatively, a more effective approach is to manually onboard a small, dedicated group of users and strive for their enthusiastic adoption.
“It’s much better to build a product that a small number of users love than a product that a large number of users like.” - Sam Altman, President of Y Combinator (emphasis mine)
Moving Forward with App Analytics
Armed with these insights and tools, prioritize continuous measurement and testing to improve your app’s performance. One effective strategy is to maintain constant visibility of these metrics for yourself and your team. Display them on a screen in the office, updating them daily. Experiment with different tests each month and track their impact diligently. Here are additional metrics worth exploring:
- User Interviews Conducted: This metric consistently proves to be a strong indicator of success. Incorporate it into your tracking and prioritize increasing it. Remember, what gets measured, gets improved.
- Viral Growth: How many friends does a user tell about your app after downloading it? A number greater than one signifies viral potential!
- Churn Rate (for Subscription-based Apps): If 100 users subscribe, how many renew the following month? For subscription-based apps, LTV can be determined using a formula similar to the one mentioned earlier. Instead of ARPDAU, use the subscription price, and substitute user lifetime with the average subscription duration derived from the churn rate.
The abundance of analytics metrics exists for a reason. Some hold greater relevance than others depending on the type of app. In the next installment of this series, we’ll delve into critical metrics for subscription-based apps. Thanks for reading!