For business owners, achieving higher search rankings for their websites is a primary goal, while developers strive to fulfill this need by building sites optimized for search engines. Google employs hundreds of factors to determine website rankings on its Search Engine Results Page (SERP).
Page speed became an officially recognized ranking factor in in mid-2018. This article will delve into a crucial performance metric that demands attention from business owners: PageSpeed Insights. We’ll explore technical aspects to empower software developers in optimizing page speed, particularly for complex scenarios like single-page applications, including those built with React.
The Importance of Excelling in Google’s PageSpeed Insights Test
Introduced in 2010, Google’s PageSpeed Tools quickly gained traction among website owners. For those unfamiliar with using PageSpeed Insights, a simple visit to the tool allows them to assess their sites.
This service generates a page speed report, offering insights into website performance across both desktop and mobile browsers. It’s easy to overlook the ability to switch between these views using the “Mobile” and “Desktop” tabs located at the top of the PageSpeed Insights analysis:

Due to their compact nature and focus on battery conservation, mobile devices often exhibit slower browser performance compared to desktop systems. Therefore, anticipate a higher score for the desktop version.
While tech giants consistently achieve high scores, smaller websites operating with limited budgets may face challenges. Business owners can leverage PageSpeed Insights to analyze competitors’ sites, comparing results with their own to determine if performance enhancements are warranted. This approach positions page speed testing as a valuable element of competitive analysis.
Achieving a Passing Score in the PageSpeed Assessment
PageSpeed utilizes metrics from Core Web Vitals to deliver a pass/fail evaluation.
This tool provides three distinct scores:
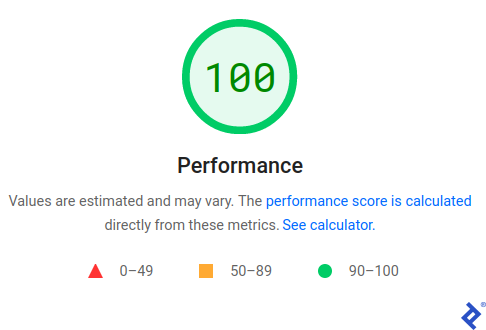
Performance Score: This score is prominently displayed within a colored circle in the “Diagnose Performance Issues” section. It is derived from PageSpeed’s internal virtual machines, configured to emulate the average mobile or desktop device. It’s important to note that this value specifically reflects page loading within PageSpeed’s virtual environment and is not a direct factor in Google’s search ranking algorithm.
While helpful for developers tracking the performance impact of website modifications, Google’s search engine relies solely on the detailed scores.
Single-Page Score: Detailed performance scores for a specific page, as well as pages deemed similar by PageSpeed, are calculated using data gathered from Chrome browsers. These statistics, collected on real user devices, are transmitted to Google. Consequently, performance on non-Chromium browsers like Firefox, Safari, and others is not factored into this assessment.
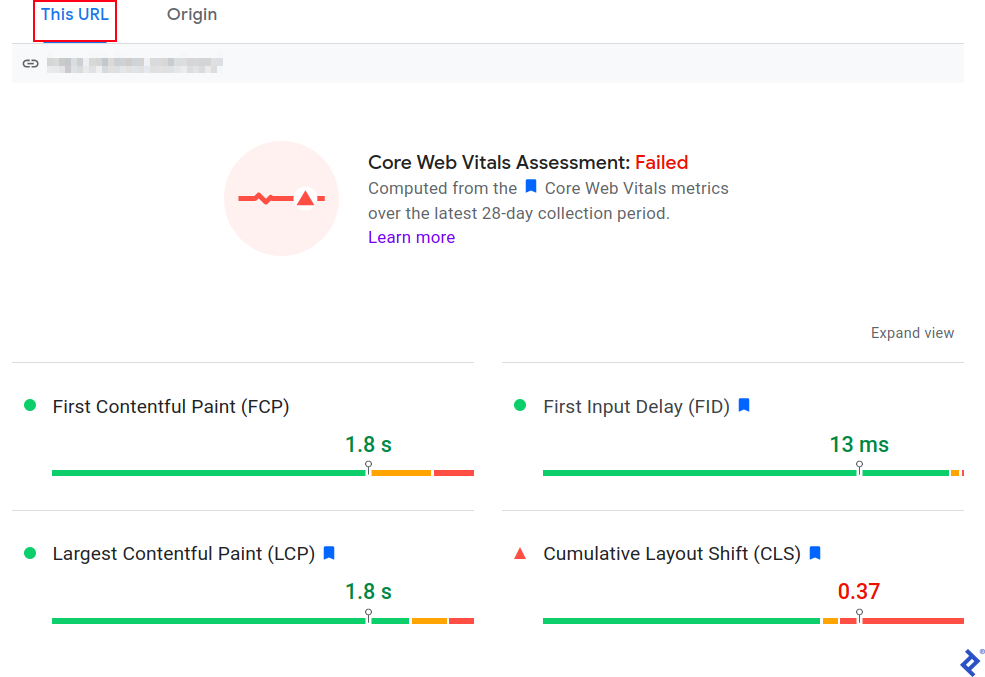
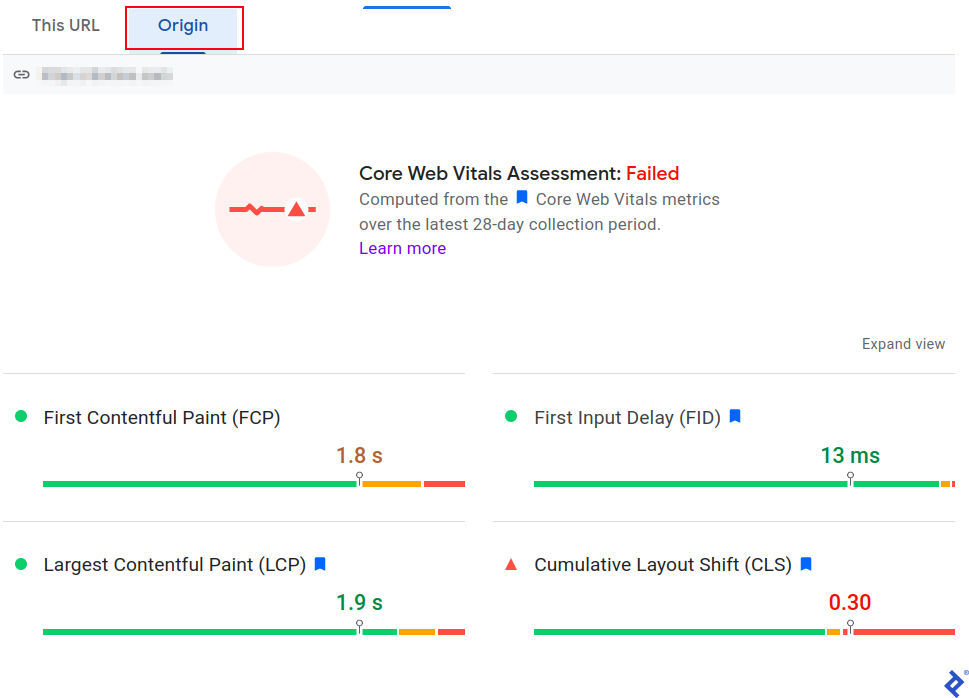
Website-Wide Score: Similar to the single-page score, the aggregate performance for all pages on a website is derived from Chrome user data. To access this score, select the “Origin” tab instead of the “This URL” tab. The URL displayed beneath the tab bar will change, with “Origin” showing the site’s main page (domain only).


Google regularly updates its PageSpeed metrics. To stay informed about the latest criteria, refer to the “Experience / Core Web Vitals” section within Google Search Console, assuming you’ve already added your website.
Passing the Core Web Vitals Assessment requires achieving green scores across all metrics:

A green score necessitates a minimum of 75% in the test, with a significant portion of users experiencing equivalent or superior performance. Note that the threshold varies for each score and is notably higher for FID (First Input Delay).
Clicking on a score title provides further insight:

This action leads to a blog post elaborating on the specific thresholds for that category.
Data is aggregated over 28 days, and two key distinctions exist compared to real-world user experiences:
Device and Network Variability: Real-world device capabilities and internet speeds fluctuate, resulting in potential discrepancies between these test results and those obtained from PageSpeed’s virtual machine.
Worst-Case Scenario: Detailed ratings encompass the entire page lifecycle, incorporating the lowest values recorded within each five-second interval the page remains open.
For websites with a user base concentrated in regions plagued by slow internet speeds or utilizing outdated devices, the performance disparity can be substantial. While not directly addressed in PageSpeed Insights’ improvement recommendations, we’ll explore potential solutions later.
Enhancing Scores Based on PageSpeed Insights Recommendations
The primary driver of the performance score is how the majority of users interact with a page. While not all users engage with a website for extended periods or visit frequently, the assessment considers all users. Consequently, prioritizing page load speed optimizations, which benefit everyone, is a sensible starting point.
The “Opportunities” section, located below the assessment results, provides actionable recommendations.

Expanding each item reveals detailed improvement suggestions. Amidst the wealth of information, here are some fundamental tips:
- Optimize Server Response Time: Consider upgrading your hosting plan if you’re on shared hosting. Explore options like a virtual private server (VPS) or even a dedicated server. Remember, not all hosting providers are created equal; prioritize those with robust hardware and reliable uptime guarantees.
- Minimize Website Traffic Load: Optimize images by converting them to appropriate formats, adjusting resolution and compression levels, and replacing animated images with static ones when feasible. Many popular content management systems offer plugins to streamline this process.
- Maximize Data Caching: Employ a content delivery network (CDN) like Cloudflare to cache static content such as images, stylesheets, scripts, and infrequently updated pages. Configuring caching rules can further enhance performance.
Let’s now shift our focus to more intricate factors where the expertise of an experienced programmer proves invaluable.
Debugging Scores Throughout the Page Lifecycle
As previously mentioned, Google Search Console takes into account the average scores obtained from Chromium-based browsers over the preceding 28 days, including values spanning the entire page lifecycle.
The inability to monitor performance throughout the page’s lifespan poses a challenge. PageSpeed’s virtual machine cannot replicate how a page behaves once loaded and actively interacted with. This limitation deprives developers of valuable insights and improvement recommendations.
A solution lies in integrating the Google Chrome Web Vitals library into the development version of your website.
Refer to the library’s README.md file on GitHub for various integration options. The simplest approach involves adding the following script, modified to display values over the page’s lifetime, within the <head> section of your main template:
| |
Please be aware that Cumulative Layout Shift (CLS) and Largest Contentful Paint (LCP) calculations are exclusive to Chromium-based browsers such as Chrome, Opera, Brave (disable Brave Shields for compatibility), and most other modern browsers. Firefox, built on the Mozilla engine, and Apple’s Safari browser are exceptions.
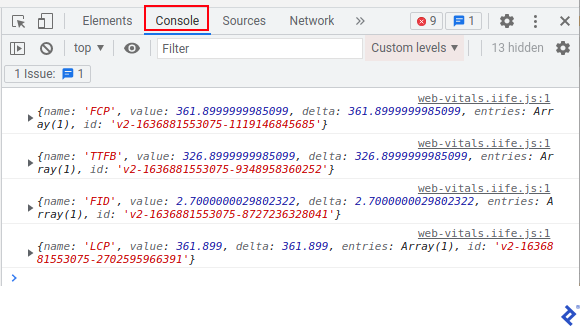
After incorporating the script and refreshing the page, open your browser’s developer tools and navigate to the “Console” tab.
To observe how these values are calculated for the mobile version, switch to a mobile device emulation using the “Device Toolbar.” Access this toolbar by clicking the “Toggle Device Toolbar” button within your browser’s Developer Tools.

This approach aids in pinpointing performance bottlenecks. Expanding the relevant row in the console reveals details about what triggered a score change.
In many cases, the automated advice provided for other scores is sufficient to guide improvements. However, CLS fluctuates after the initial page load as users interact with the page. Recommendations might be absent, especially for single-page applications. You might observe a perfect score of 100 in the “Diagnose Performance Issues” section while your page still fails the assessment due to factors considered by the search engine.
For those grappling with CLS, the following will prove beneficial. Expand the log record, then “entries,” the specific entry, “sources,” the specific source, and compare the currentRect with the previousRect:

With a clear understanding of the changes, we can devise solutions.
Minimizing Cumulative Layout Shift
CLS, arguably the most elusive metric, holds immense significance for user experience. Layout shifts occur when elements are added to the Document Object Model (DOM) or when the size or position of existing elements changes. This behavior causes subsequent elements to shift, leading to a disruptive experience that can frustrate users and increase the likelihood of leave the website.
Addressing CLS on a simple HTML page is relatively straightforward. Assigning width and height attributes to images prevents content below them from shifting during image loading, effectively mitigating the issue.
However, for dynamic pages that function like applications, consider these steps to tackle CLS:
- Delay Content Display: Configure the page to display content 500 milliseconds after user interaction (e.g., clicking a button or link) without triggering CLS.
- Prioritize Non-Shifting Parameter Changes: Focus on modifying parameters that don’t impact the layout, such as background colors and text colors.
- Prevent Element Shifting: Ensure that changes to an element’s size or position do not affect the positioning of other elements.
The Google Developers Optimize CLS page offers more comprehensive recommendations.
Leveraging the 500-Millisecond Rule to Reduce CLS
Let’s illustrate the 500-millisecond threshold concept with an image upload example.
Typically, when a user uploads a file, the script inserts an <img> element into the DOM. The client browser then fetches the image from the server. This process can take over 500 milliseconds, potentially leading to layout shifts.
To expedite image retrieval, leverage the fact that the image is already present on the user’s device. This allows you to create the <img> element before the 500-millisecond deadline.
Below is a universal example using pure ECMAScript, compatible with most modern browsers:
| |
As demonstrated, resolving these types of issues may demand creativity. With the prevalence of mobile devices, particularly those with limited resources, coupled with often slower mobile internet speeds, the art of performance optimization reminiscent of the ’90s gains renewed relevance. Modern browser debugging tools provide invaluable assistance in this endeavor.
Updating Google Search Console
After identifying and rectifying performance issues, it might take some time for Google’s search engine to reflect these changes. To expedite this process, notify Google Search Console about the implemented fixes.
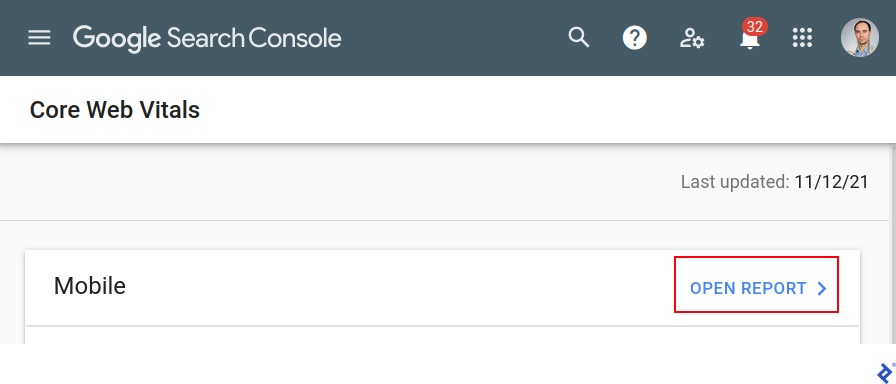
Begin by selecting the target page using the “Search property” box located in the top left corner. Next, navigate to “Core Web Vitals” within the left hamburger menu:
Click the “Open Report” button situated in the top right corner of either the mobile or desktop report. If both versions require attention, repeat these steps for the second report afterward.
Proceed to the “Details” section beneath the chart and click the row displaying the failed validation warning.

Click the “See Details” button associated with this issue.

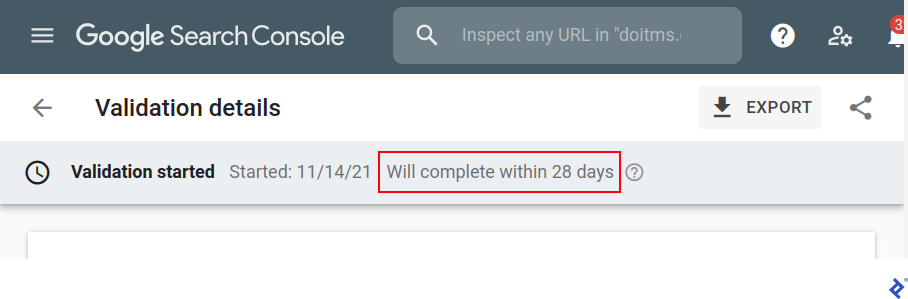
Finally, initiate a new validation by clicking “Start New Validation.”

Exercise patience, as validation can take up to 28 days.
Optimization: An Ongoing Pursuit
SEO optimization, much like performance optimization, is a continuous endeavor. As your audience expands, servers handle a larger volume of requests, potentially impacting response times. Growth often necessitates the introduction of new features, which can, in turn, affect performance.
Finding the right balance between cost and benefit is crucial in performance optimization. Striving for absolute peak performance across all websites at all times is not always necessary or feasible. Prioritize addressing the most significant performance bottlenecks for optimal resource allocation and faster results. While large corporations might have the resources to excel in all areas, small and midsize businesses should aim to match or surpass their direct competitors rather than industry giants like Amazon.
Business owners should grasp the importance of website optimization, understand the key areas of focus, and seek out professionals with the requisite skills. Developers, in turn, should adopt a performance-centric mindset, assisting clients in creating websites that not only deliver a fast user experience but also achieve favorable scores in PageSpeed Insights.