Building software can get really complex, as we developers have to juggle numerous variables. Some are beyond our control, others remain hidden until our code runs, while some are directly in our hands. And for .NET developers, this holds true as well.
Given this, things often proceed smoothly in controlled settings, such as our development machines or integration environments that we fully control. Here, we have tools to analyze how various factors impact our code and software. We’re also free from the burden of heavy server loads or many users performing the same actions concurrently.
In such predictable and secure environments, our code performs flawlessly. However, once in production, under heavy load or influenced by external factors, unexpected issues can arise. Analyzing production performance is tricky. Often, we must address potential issues theoretically, knowing they might occur but lacking the means to test them. Therefore, we depend on best practices and language documentation to guide our development and avoid common pitfalls.
As mentioned, going live can bring unforeseen problems, causing our code to behave in unplanned ways. We might face situations where debugging is impossible, leaving us in the dark about what’s happening. So, what can we do?

This article examines a real-world scenario of high CPU usage in a .NET web application on a Windows server. We’ll delve into the processes that helped identify the problem, and more importantly, explore the root cause and its solution.
CPU usage and memory consumption are frequent discussion topics. Pinpointing the ideal resource allocation (CPU, RAM, I/O) for a specific process and its duration is challenging. However, one thing is certain: if a process consistently utilizes over 90% of the CPU for an extended period, trouble is brewing, as the server becomes incapable of handling other requests.
Does this automatically signify a faulty process? Not necessarily. It could indicate a need for more processing power or handling a large volume of data. Our initial step is to investigate the cause.
Operating systems provide various tools to monitor server activity. Windows servers offer the task manager, Performance Monitor, while we opted for New Relic Servers, an excellent server monitoring tool.
Initial Signs and Problem Diagnosis
Following our application deployment, within the first two weeks, we observed CPU usage spikes that rendered the server unresponsive, necessitating restarts. This occurred three times during that period. As mentioned, we were using New Relic Servers for monitoring, which revealed that the w3wp.exe process consumed 94% of the CPU during these crashes.
An IIS worker process (w3wp.exe) executes Web applications, handling requests sent to a Web Server for a specific application pool. An IIS server can host multiple application pools (and multiple w3wp.exe processes), potentially causing the issue. We identified the culprit as our legacy .NET C# web form application based on the user associated with the process, as indicated in the New Relic reports.
Due to the close integration of the .NET Framework with Windows debugging tools, we first inspected the event viewer and application logs for clues. While there were exceptions logged, they lacked sufficient detail for analysis. Consequently, we decided to gather more information to be better prepared for future occurrences.
Data Gathering
Debug Diagnostic Tools v2.0, or simply DebugDiag, offers the easiest way to collect user-mode process dumps. DebugDiag provides tools for both data collection (DebugDiag Collection) and analysis (DebugDiag Analysis).
Let’s configure rules for collecting data using Debug Diagnostic Tools:
Open DebugDiag Collection and select
Performance.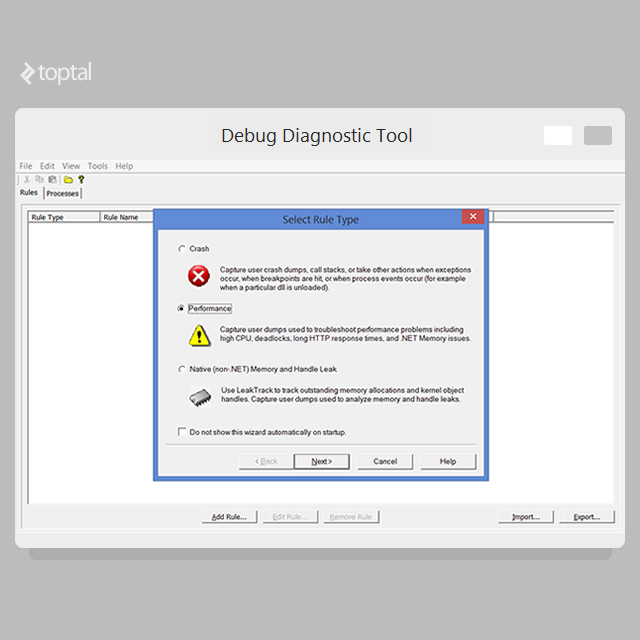
Choose
Performance Countersand clickNext.Click
Add Perf Triggers.Expand the
Processor(not theProcess) object and select% Processor Time. For Windows Server 2008 R2 with over 64 processors, choose theProcessor Informationobject instead.Select
_Totalfrom the instances list.Click
Addand thenOK.Select the newly added trigger and click
Edit Thresholds.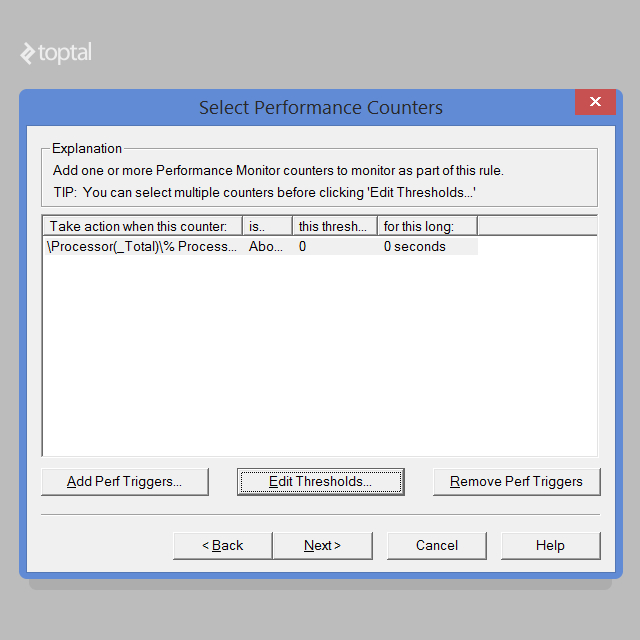
Choose
Abovefrom the dropdown.Set the threshold to
80.Enter
20for the number of seconds. Adjust this value cautiously to avoid false triggers.
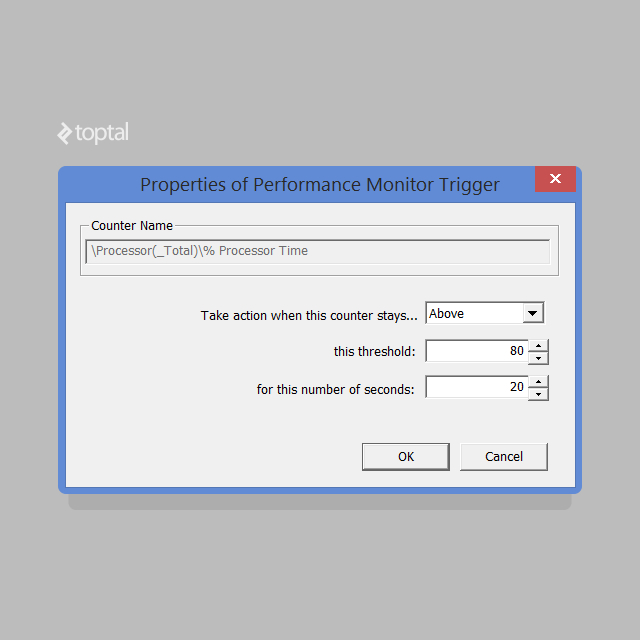
- Click
OK. - Click
Next. - Click
Add Dump Target. - Select
Web Application Poolfrom the dropdown. - Choose your application pool from the list.
- Click
OK. - Click
Next. - Click
Nextagain. - Optionally name your rule and note the dump file save location, which you can modify.
- Click
Next. - Select
Activate the Rule Nowand clickFinish.
This rule generates a series of minidump files, which are relatively small. The final dump captures the full memory, resulting in a much larger file. Now, we wait for the high CPU event to recur.
Once we have the dump files, we’ll analyze them using the DebugDiag Analysis tool:
Select Performance Analyzers.
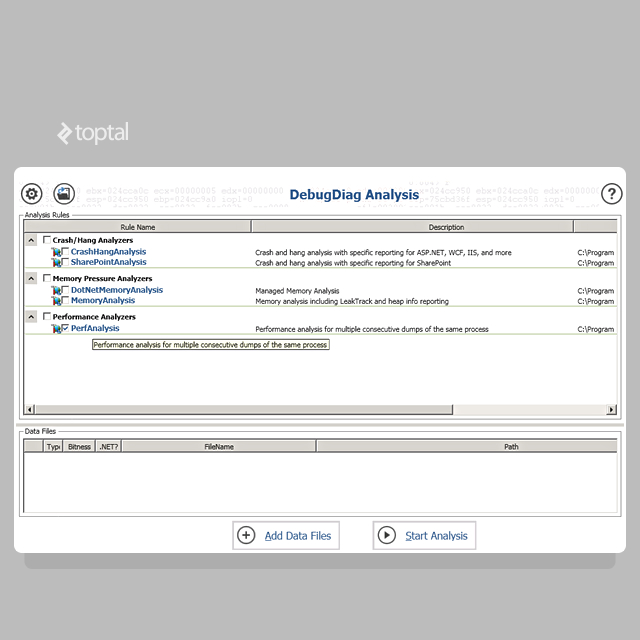
Add the dump files.
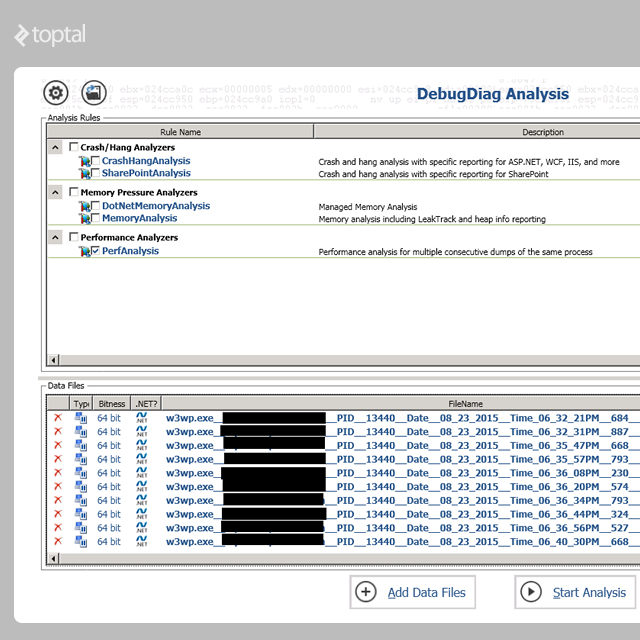
Start Analysis.
DebugDiag requires a few (or several) minutes to process the dumps and generate an analysis. Once completed, a web page displays a summary and detailed information about threads, resembling the following:
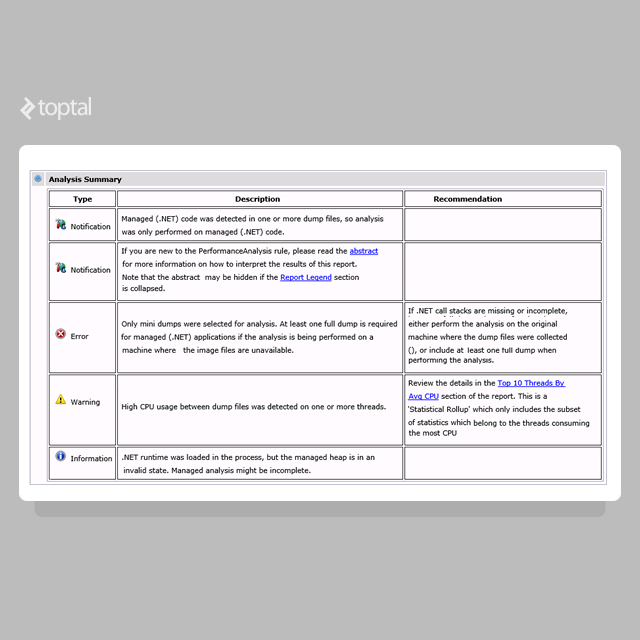
The summary warns of “High CPU usage between dump files was detected on one or more threads.” Clicking on the recommendation sheds light on the issue within our application. Our report looks like this:
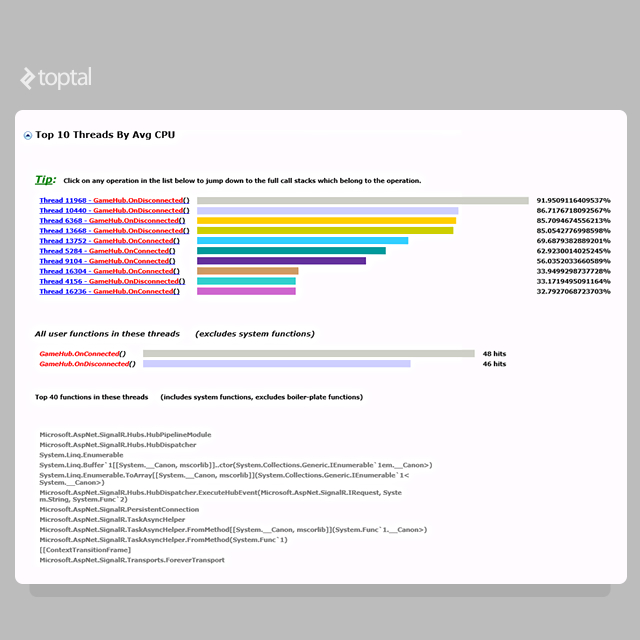
A pattern emerges in the report’s CPU usage. All threads exhibiting high CPU usage are linked to the same class. Let’s examine the first one before diving into the code.
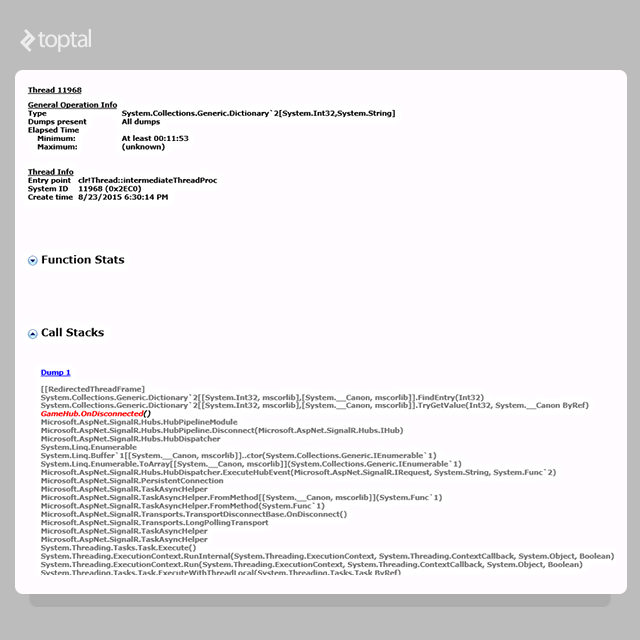
Here’s the breakdown of the problematic thread. The crucial part is as follows:
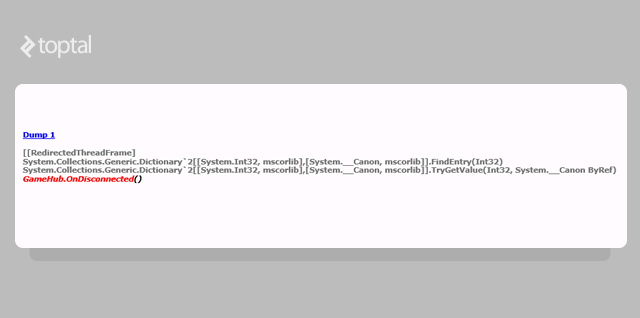
We see a call to our code GameHub.OnDisconnected(), triggering the problematic operation. However, preceding that call are two Dictionary calls, offering clues about the issue. Let’s inspect the .NET code to understand the method’s actions:
| |
We’ve stumbled upon a problem. The report’s call stack pointed to a Dictionary issue, and this code interacts with a dictionary. The problematic line is:
| |
Here’s the dictionary declaration:
| |
Unraveling the .NET Code Issue
Programmers with object-oriented experience understand that static variables are shared among all instances of a class. Let’s delve into the meaning of “static” in the .NET realm.
The .NET C# specification states:
Use the static modifier to declare a static member, which belongs to the type itself rather than to a specific object.
Concerning static classes and members, the .NET C# language specification explains:
Like all class types, the type information for a static class is loaded by the .NET Framework common language runtime (CLR) when the referencing program is loaded. The exact loading time is not user-specifiable. However, loading, field initialization, and static constructor execution are guaranteed before the first class reference within the program. A static constructor is called only once, and a static class resides in memory for the lifetime of its application domain.
Non-static classes can contain static methods, fields, properties, or events. Static members are callable on a class even without an instance. Access is always through the class name, not the instance name. Only one copy of a static member exists, regardless of the number of class instances. Static methods and properties cannot directly access non-static members or events within their containing type or instance variables of any object unless explicitly passed as parameters.
Therefore, static members belong to the type itself, not the object, and reside within the application domain loaded by the CLR. Consequently, they are associated with the hosting process rather than specific threads.
Web environments are inherently multithreaded, with each request spawning a new thread within the w3wp.exe process. Since static members are process-wide, multiple threads might concurrently access and modify static variables, potentially leading to multithreading issues.
The Dictionary documentation documentation mentions thread safety:
A
Dictionary<TKey, TValue>supports multiple concurrent readers if unmodified. However, enumeration is inherently not thread-safe. In rare cases of enumeration contention with writes, the collection must be locked throughout. To enable multi-threaded read/write access, implement custom synchronization.
This explains the problem. The dumps revealed the issue stemmed from the dictionary’s FindEntry method:
Examining the dictionary’s FindEntry implementation reveals that it iterates through the internal structure (buckets) to locate the value.
Consequently, the following .NET code, which enumerates the collection, is not thread-safe:
| |
Conclusion
The dumps showed multiple threads simultaneously attempting to iterate and modify a shared resource (the static dictionary), ultimately trapping the iteration in an infinite loop and causing excessive CPU consumption by the thread.
Several solutions exist. Our initial fix involved locking and synchronizing access to the dictionary, sacrificing some performance. Given the daily server crashes, a swift resolution was critical, and this solution, though not optimal, stabilized the situation.
The next step is to analyze and optimize the code. Refactoring is an option, potentially using the new ConcurrentDictionary class, which locks only at the bucket level, improving overall performance. However, this requires careful consideration and further analysis.