Interactive maps with location markers are a ubiquitous feature in modern mobile applications. For example, the Airbnb app utilizes these markers, retrieved from a web service, to display available accommodations on a map.
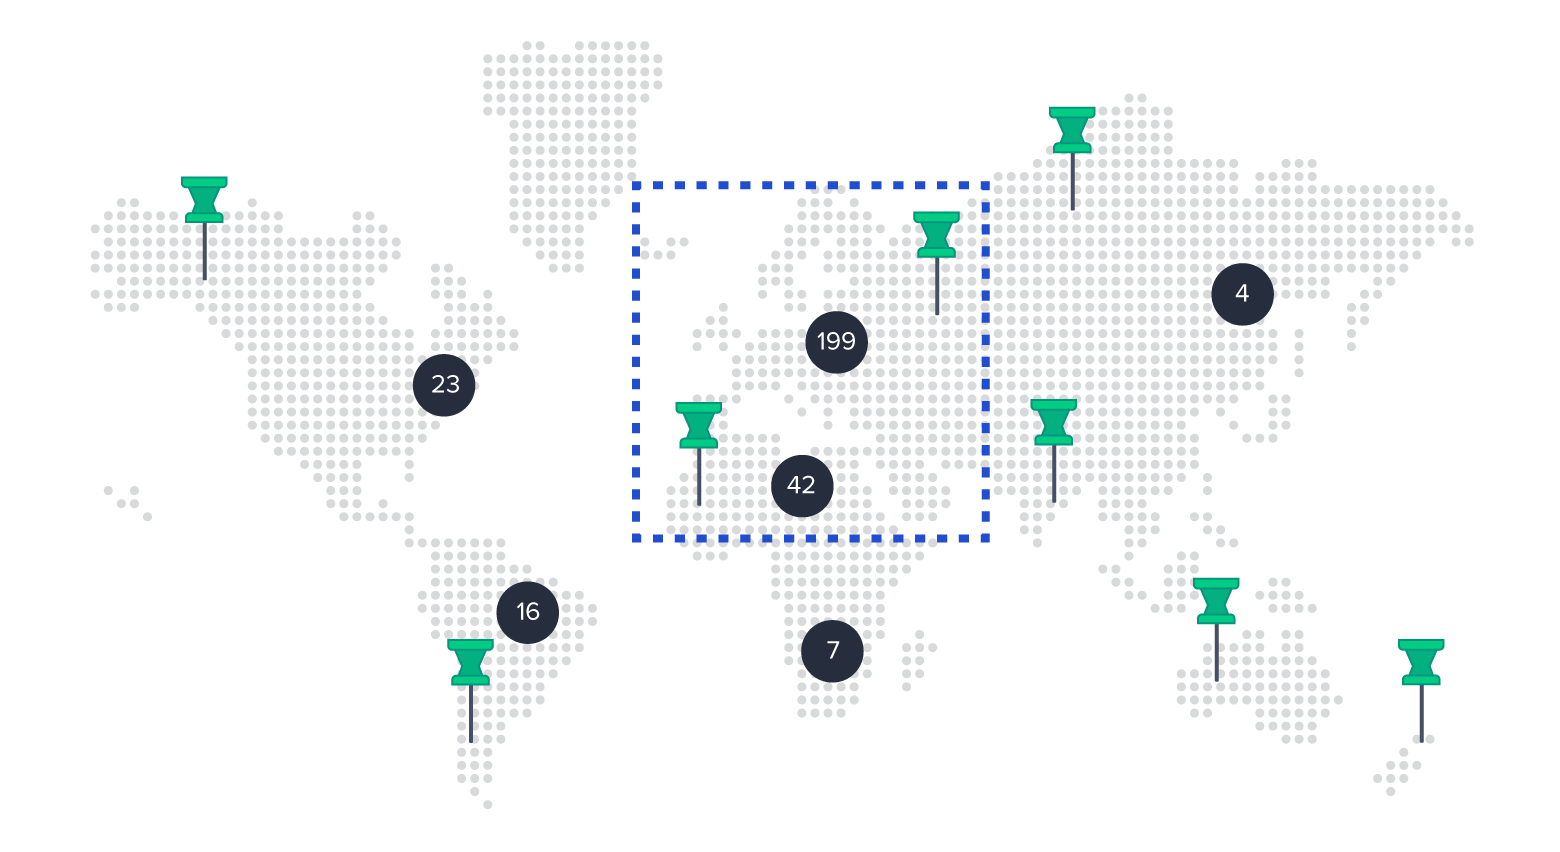
To prevent data overload as the number of markers increases, the server typically groups these markers before sending them to the client. This grouping is called a map cluster, a special marker that represents the average position of the markers it encompasses. It’s labeled with the number of markers it represents.
However, serving clusters can create performance issues, as the web service must fetch each marker within a specific geographical area from the database. Fortunately, caching strategies can mitigate this challenge. To illustrate how to design and manage such a cache, let’s examine a map API endpoint I developed for the Playsports app.
Scalability Challenges and a Simple Approach
In the Playsports map, each marker signifies a sports venue. The map’s API endpoint must return a list of markers and marker clusters, based on a specified zoom level and bounding box.
With a small number of markers, we can retrieve all markers within the bounding box from the database, cluster them as needed, and send the resulting markers and clusters to the client.
Initially, the maximum marker count in any reachable bounding box within Playsports was approximately 400, resulting in an endpoint response time of roughly 0.5 seconds. This simple solution was adequate for this use case.
However, as the number of markers increased, the inefficiency of this approach became evident. Following the addition of approximately 10,000 new sports venue markers, the endpoint response time deteriorated to around 4.3 seconds at certain zoom levels. This delay significantly exceeds the one-second threshold generally considered acceptable for user interaction in mobile applications (the maximum acceptable delay).
To comprehend the inefficiencies of this simple solution, let’s analyze it in the context of the marker query:
- Retrieve all markers within the bounding box from the database. Most applications require fetching additional marker details beyond latitude/longitude coordinates. For instance, Airbnb markers display price, viewing history, and favorite status.
- Execute a map-clustering algorithm on the retrieved markers, incorporating the zoom level.
- Return the clusters and detailed markers to the client.
Performance degrades in Steps 1 and 2 as the marker count increases:
- Database queries become considerably slower (by 1 to 2 seconds) when the bounding box is large, and when over 10,000 markers necessitate a detail lookup through a JOIN operation.
- Processing 10,000 items through the map-clustering algorithm consumes an additional ~250 milliseconds.
Assuming a constant window size, a large bounding box typically corresponds to a low zoom level (i.e., zoomed out). At low zoom levels, clustering is favored to minimize visual clutter. Therefore, the most significant optimization potential lies in the initial step, where numerous individual markers are loaded unnecessarily.
Designing an Optimized Solution
While the naive solution struggles with worst-case scenarios (maximum bounding box in a marker-dense area), the optimized solution achieves a response time of just 73 ms, a ~58x improvement. Here’s a high-level overview:
- Caching Strategy: Retrieve markers and clusters within a bounding box from a zoom level-specific cache.
- Additional Marker Details (Optional): Augment markers with supplementary data fetched from the database.
- Result Delivery: Return the markers and clusters to the client.
The primary complexity lies in the cache architecture (Step 1).
Step 1: The Caching Strategy
This crucial step comprises six components:
Technology
Redis, a high-performance in-memory data store commonly employed as a cache, offers built-in geospatial indexing capabilities (using uses the Geohash algorithm) for efficient storage and retrieval of latitude-longitude points, which perfectly suits our marker data.
Zoom Level-Specific Caches
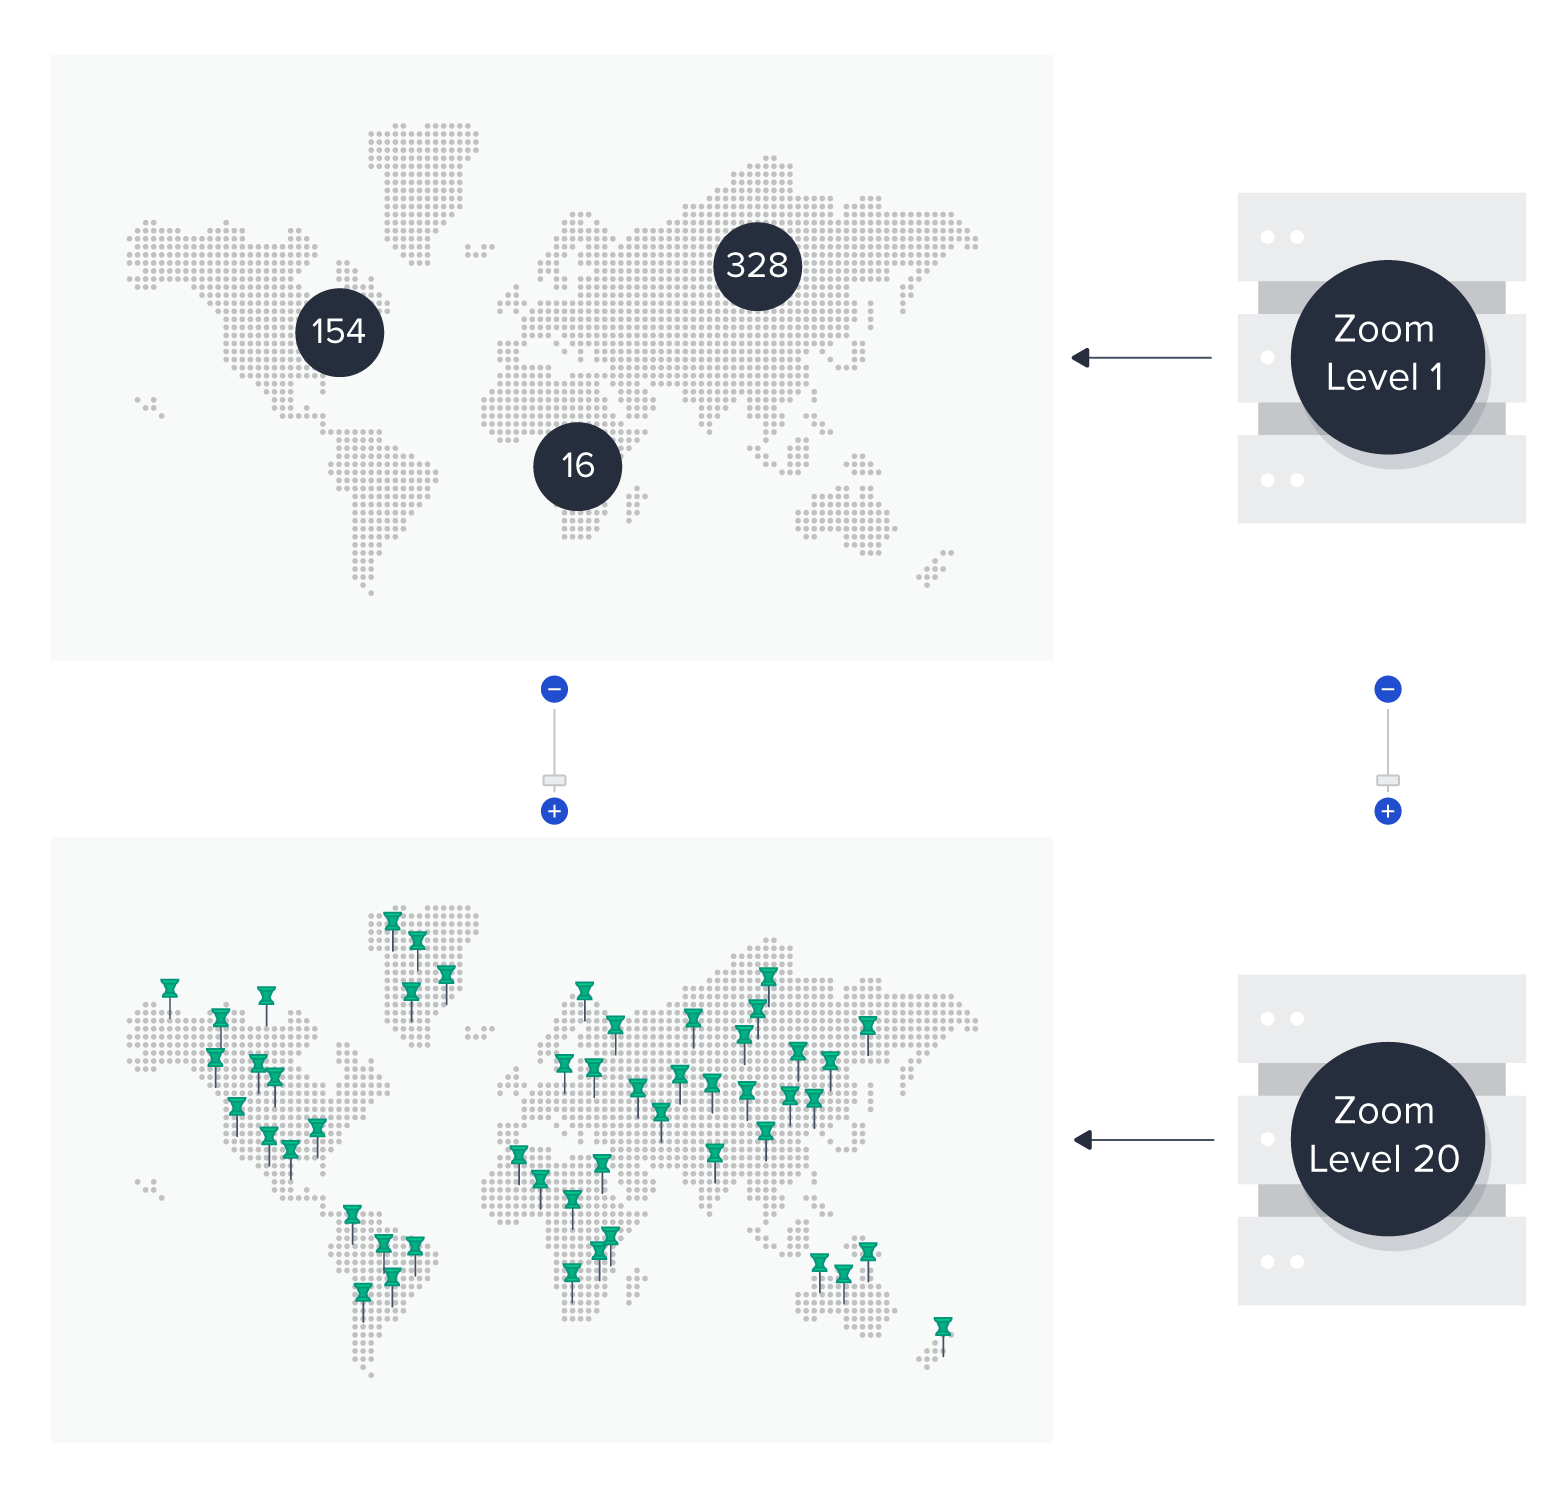
The zoom level parameter passed to the endpoint dictates the extent of map clustering (whether individual markers or clusters are returned).
- High zoom levels (zoomed in) primarily return individual markers, except in high-density areas.
- Low zoom levels (zoomed out) mainly return clusters, except in sparse areas.
Google Maps accommodates zoom levels from zero to 20 (maximum), with similar ranges in other mapping services (e.g., Mapbox uses 0 to 23). Given these integer zoom levels, we can create a dedicated cache for each.
To encompass all Google Maps zoom levels (excluding level zero, which is excessively zoomed out), we’ll create 20 separate caches. Each cache will store all markers and clusters for the entire map, clustered according to its corresponding zoom level.
Cache Data Types
Each cache would house clusters and individual markers. For each entry, we need to store:
| Field Name | Note |
|---|---|
| Type | Cluster or marker |
| Latitude and longitude | We duplicate Redis’ internal geospatial storage for convenience. |
| ID (for markers only) | In Step 2, we can use this value to fetch details beyond location, such as user interaction history. |
| Quantity of subsumed markers (for clusters only) | In Step 2, we can fetch aggregate data (e.g., the number of unviewed markers) for these too. |
However, Redis restricts geospatial sets to storing location and a single string value. We overcome this by serializing the aforementioned fields into a JSON string, which is then stored as the value in Redis. With a 512 MB limit on Redis keys and values, this approach is well within acceptable bounds.
Cache Population
Cache population involves retrieving all markers from the database. For each zoom level, we execute the map-clustering algorithm. We then utilize Redis’ GEOADD command to insert the generated markers and clusters into the corresponding zoom level cache, along with their latitude, longitude, and the JSON string.
While executing the map-clustering algorithm on the entire map (instead of on-demand for each user’s bounding box) might introduce minor cluster placement discrepancies at edges, the overall user experience remains consistent.
Cache Queries
Incoming requests, along with their bounding box, are processed using the Redis GEOSEARCH command. This command queries the appropriate zoom level cache to retrieve potential marker and cluster candidates within the specified area.
Cache Refresh Strategy
Given the cost of refreshing a 20-level cache, minimizing refresh frequency is desirable. In Playsports, adding or removing a sports venue marks the cache as stale, triggering a potential hourly cron job refresh. More on this in the Cache Staleness section.
Step 2: Additional Marker Details (Optional)
At this stage, many applications require fetching additional details based on individual marker IDs. While storing this data within the cached JSON strings is an option, marker details are often user-specific. Since we have a single, shared cache, this approach is not feasible.
Instead, our optimized solution extracts individual marker IDs from the cache results and retrieves their details from the database. This targets only the remaining individual markers after clustering, minimizing database load.
Unlike the naive approach (which fetches details for all markers within the bounding box before clustering), this optional but often crucial step becomes significantly faster.
Step 3: Returning the Result
With clusters generated and individual markers augmented, we deliver the data to the client. Barring minor edge cases, the resulting data closely resembles the output of the naive solution, but with drastically improved delivery speed.
Further Considerations
Let’s delve into two additional aspects:
Resource Requirements
Assuming an application map contains N markers and up to 20 zoom levels, the maximum cache size would be 20N items. In reality, clustering, especially at lower zoom levels, significantly reduces this number. In Playsports, the total cache item count across all caches is roughly 2N.
Furthermore, assuming a cache value length (stringified JSON) of ~250 characters (reasonable for Playsports) and 1 byte per character, JSON value storage would require approximately 2 * N * 250 bytes.
Adding Redis’ internal data structures (sorted sets for GEOADD) and considering Redis uses 85 MB of memory for 1 million small key-value pairs, we can estimate less than 100 bytes per cache item for Redis internals. Consequently, a 1 GB-RAM Redis instance could accommodate up to 1.4 million markers. Even with an unlikely even marker distribution across the entire map (approaching 20N cache items), N could still reach ~140,000. With Redis’ capacity exceeding 4 billion keys (232), this is not a limiting factor.
Cache Staleness
Periodic cache refreshes might not suffice for certain use cases. In such scenarios, a rate-limited task queue can minimize cache staleness while controlling refresh frequency and system load.
Each database update would enqueue a cache refresh job, with the queue limiting task execution to M per hour. This compromise facilitates faster-than-hourly updates while managing system load (depending on M).
Caching Strategies Outperform Map-clustering Algorithms Alone
The optimized solution implemented for Playsports, over 50 times faster than the naive approach, has proven highly effective. It’s expected to remain viable until marker counts reach 1.4 million or exceed 100 times the current data volume.
For most map-based web service requests, pre-computation is crucial for scalability. The specific technology and design choices depend on factors like cache staleness requirements, marker augmentation needs, and the overall number of markers.