Software development is a constantly evolving field. New technologies, domains, and tools emerge frequently, while languages shift in a seemingly chaotic manner.
Despite these changes, some fundamental principles remain constant. One crucial rule for building exceptional software is to gain deep, continuous, and detailed insight into your running system. Terms like diagnostics, debugging, and profiling are often used in this context, but the principle runs deeper. A skilled developer truly “understands” their system. They know what will cause it to pause waiting for memory, what will lead to CPU starvation, and what actions will result in heavy I/O or network usage, slowing down the entire operation.
There is no substitute for this understanding. You can be a brilliant developer writing excellent code, but without the ability to monitor and analyze your system’s runtime behavior, you will struggle to deliver truly top-notch applications.
With experience, you’ll even recognize a whole class of “code issues” stemming from neglecting this principle of introspection: essentially, writing code (sometimes clever code) without constantly monitoring its impact on the actual platform.
DDMS in Android: My Preferred Tool for Introspection
Fortunately, the Android community has provided us with many excellent introspection tools. Facebook’s Stetho is among the best, AT&T’s ARO (“Application Resource Optimizer”) is older but still powerful, boasting perhaps the best network monitoring console available, while LeakCanary takes a more focused approach, excelling at runtime memory leak detection. In short, there’s no shortage of Android debugging tools.
However, the crown jewel, the introspection tool to rely on when you need crucial, accurate, and well-presented data about your app’s runtime behavior, is still the trusty Dalvik Debug Monitor Server (DDMS) in Android Studio. It has been available (though sadly underutilized by many teams) since the days of the Eclipse Android plugin.
How valuable is DDMS in Android development? Well, possessing my current knowledge of DDMS and mobile app monitoring five or six years ago, as a less experienced Android developer, would have saved me countless headaches and late nights spent debugging.
And the best part is that DDMS is surprisingly easy to learn!
Of course, as with any software tool, using it effectively requires experience. You’ll need to refine your skills over time to become truly proficient at runtime performance monitoring. But even within hours, perhaps after finishing this article, you’ll see remarkable results if you implement my suggestions in your next app. Profiling and optimizing even complex systems doesn’t have to be difficult; it can even be enjoyable!
One common question arises when distinguishing between novice and expert mobile developers. Mastering DDMS in Android—or more broadly, application profiling and introspection capabilities—is a key differentiator.
Note: A significant part of becoming a top-tier developer involves utilizing the best libraries available for your platform. In a previous Toptal article, I highlighted some of the best developer libraries for Android. This article can be considered a follow-up, focusing on one of many Android tools. If you’re serious about enhancing your Android development skills, be sure to read it!
A Quick Introduction to DDMS in Android Studio
Now, let’s dive into the world of DDMS, one of the ultimate Android developer tools.
When considering effort versus reward, arguably no other tool can match the impact DDMS has on improving your app’s quality and uncovering those truly nasty and elusive bugs. Yet, for some reason (perhaps laziness?), many teams neglect to use it.
Let’s start with a crash course in DDMS:
You can access DDMS through Studio > Tools > Android > Android Device Monitor and clicking the DDMS button in the menu. You can also add it as a shortcut icon (as I do) in your top panel.
Upon opening DDMS, you’ll see this:
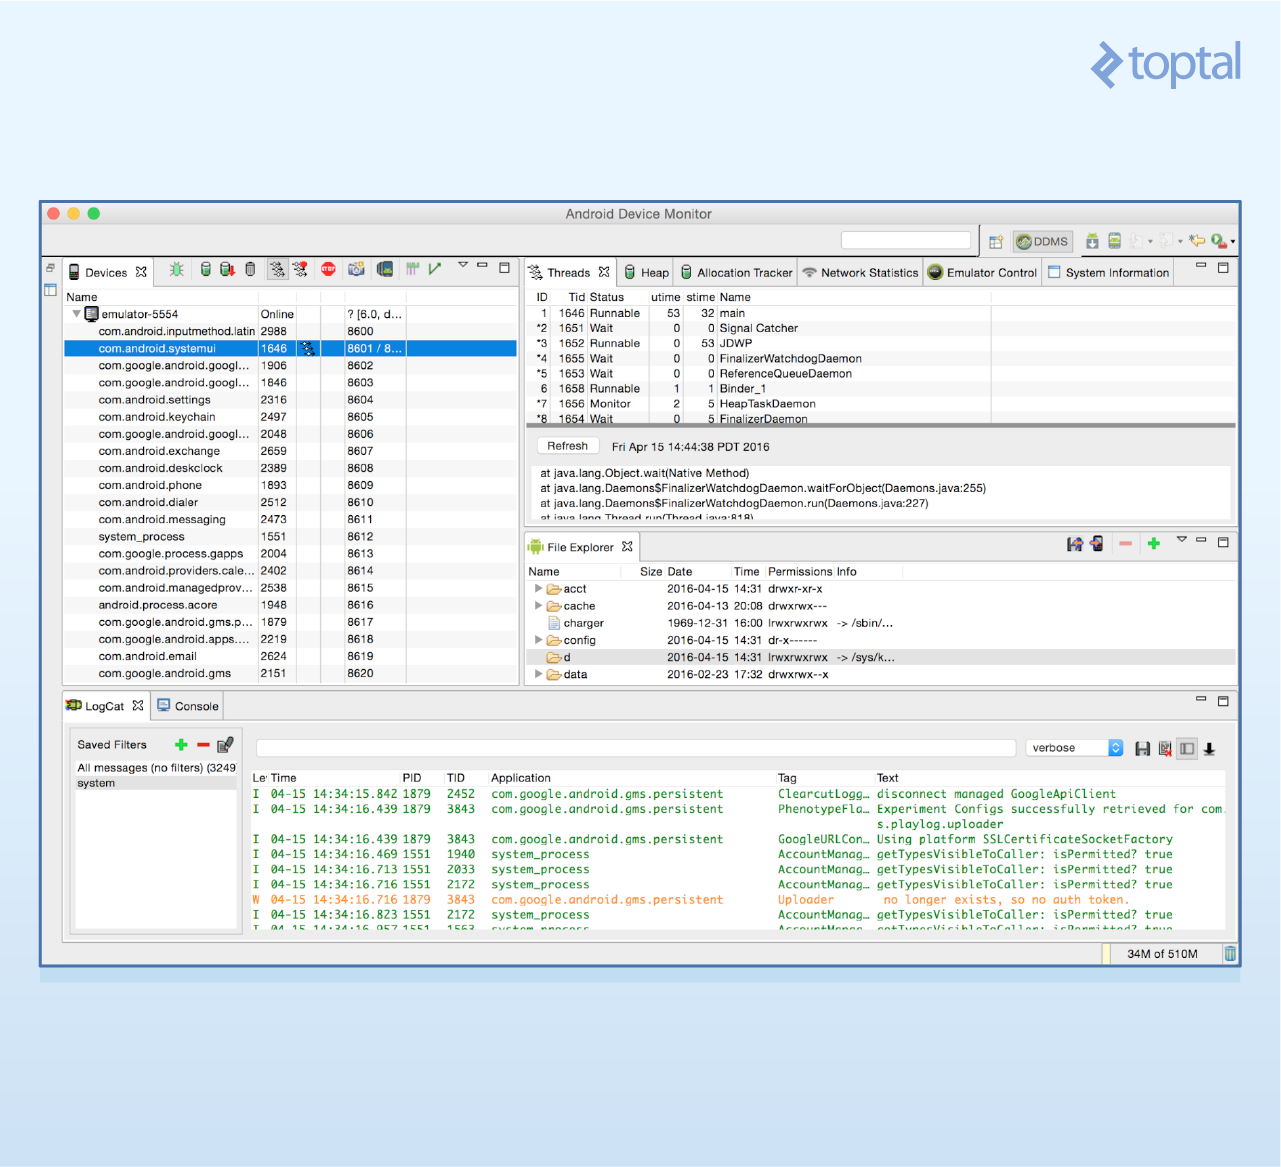
The left panel allows you to select the device/app, while the right console provides multiple views, each in its own tab, showcasing different aspects of your app.
The primary services offered by Dalvik Debug Monitor Server are:
- App memory usage statistics (total heap and object allocation statistics)
- App thread statistics
- Device screen capture
- Device file explorer
- Incoming call and SMS simulation
- Location data simulation
- Logcat
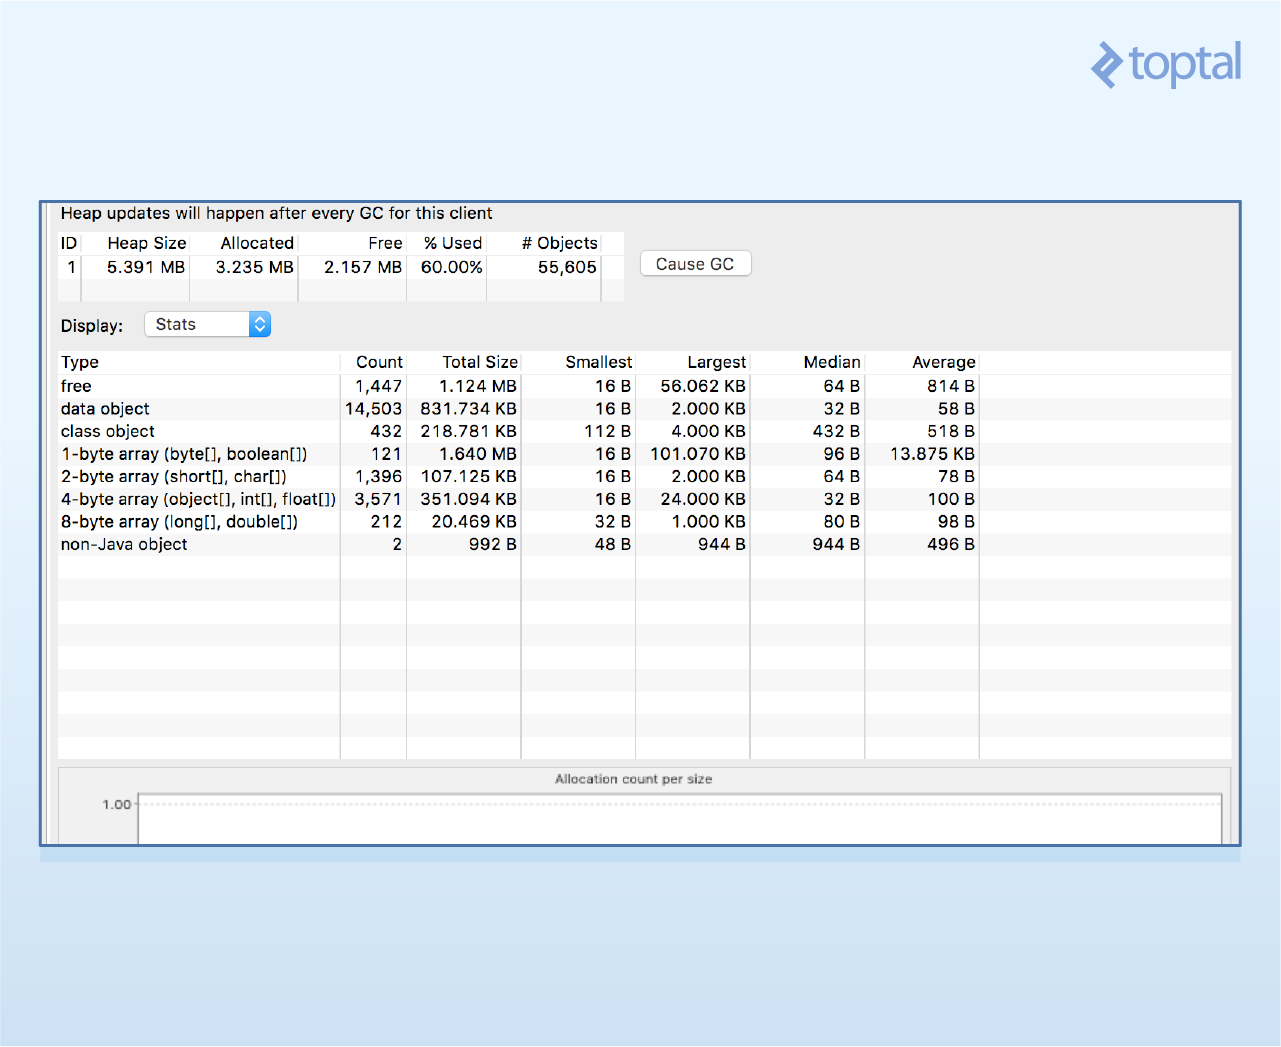
To get the current heap memory used by your app, simply:
- Connect the device running your app
- Click the Update Heap button to enable heap data collection
- Open the Heap tab
- Click “Cause GC” to force a garbage collection run. Heap data collection starts only after this run
- Keep the tab open, continue using your app, and periodically click “Cause GC” to refresh heap statistics data
This last step likely needs further clarification. Memory usage analysis prioritizes its dynamics over the initial value. For most apps, the starting heap usage isn’t very important. What matters is how this value changes, as it reveals a common nightmare for mobile developers: Android memory leaks:
My use of the heap stat module is straightforward. During app development, after making changes that should impact heap usage, I activate the module, click “Cause GC” to initiate data collection, activate the heap-intensive parts of my app (usually multiple times), and periodically click “Cause GC” to refresh the data. If heap usage keeps increasing, I have a memory leak to address (more on how to do this below). If not, I’m good, regardless of the actual heap size.
Upon detecting a memory leak, the next tool I use is the Object Allocation Tracker. Let’s explore its role in Android memory management.
Object Allocation Tracker
Put simply, the allocation tracker tells you who’s responsible for the current heap size. It shows you the threads and methods that issued the allocation commands in real time, making it invaluable for memory analysis in Android.
To start tracking, do the following:
- Select the relevant device/process
- Switch to the Allocation Tracker tab and click Start Tracking.
- All new allocations from this point will be tracked
- Click “Get Allocations” to get a list of recent allocations (since the last “begin”)
- Click on a specific line in the list to find out who initiated the allocation

In my experience, performing allocation-heavy actions in your app and then clicking “Get Allocations” usually points you directly to the leak. However, there are cases, such as non-linear leaks (those happening sporadically) or apps with multiple leaks, where this might not be sufficient. In such situations, which I haven’t encountered often, you’ll need to manually create and analyze a dump HPROF file. In-depth coverage of memory analysis and Android memory management is beyond the scope of this article. Refer to here for further information.
Thread Info Console: Simplifying Android CPU Usage
As any developer knows, synchronized paths of executing logic are organized into threads, each representing a sequential flow of execution within your app. Virtually all apps use more than one thread. Some use dozens.
A comprehensive examination of potential threading issues is beyond the scope of this article. Let’s focus on thread starvation, the primary reason you’d use the thread info console.
In mobile applications, different threads compete for limited CPU time. What happens if one or more threads don’t get the execution time they need? Typically, bad things. The system deviates from its intended behavior, which is never good. Potential causes include low priority settings, other simultaneously executing threads with excessively high priorities, long waits on synchronization monitors, and more. These issues are notoriously difficult to detect through code review alone.
This is where the Android DDMS thread console comes in handy!
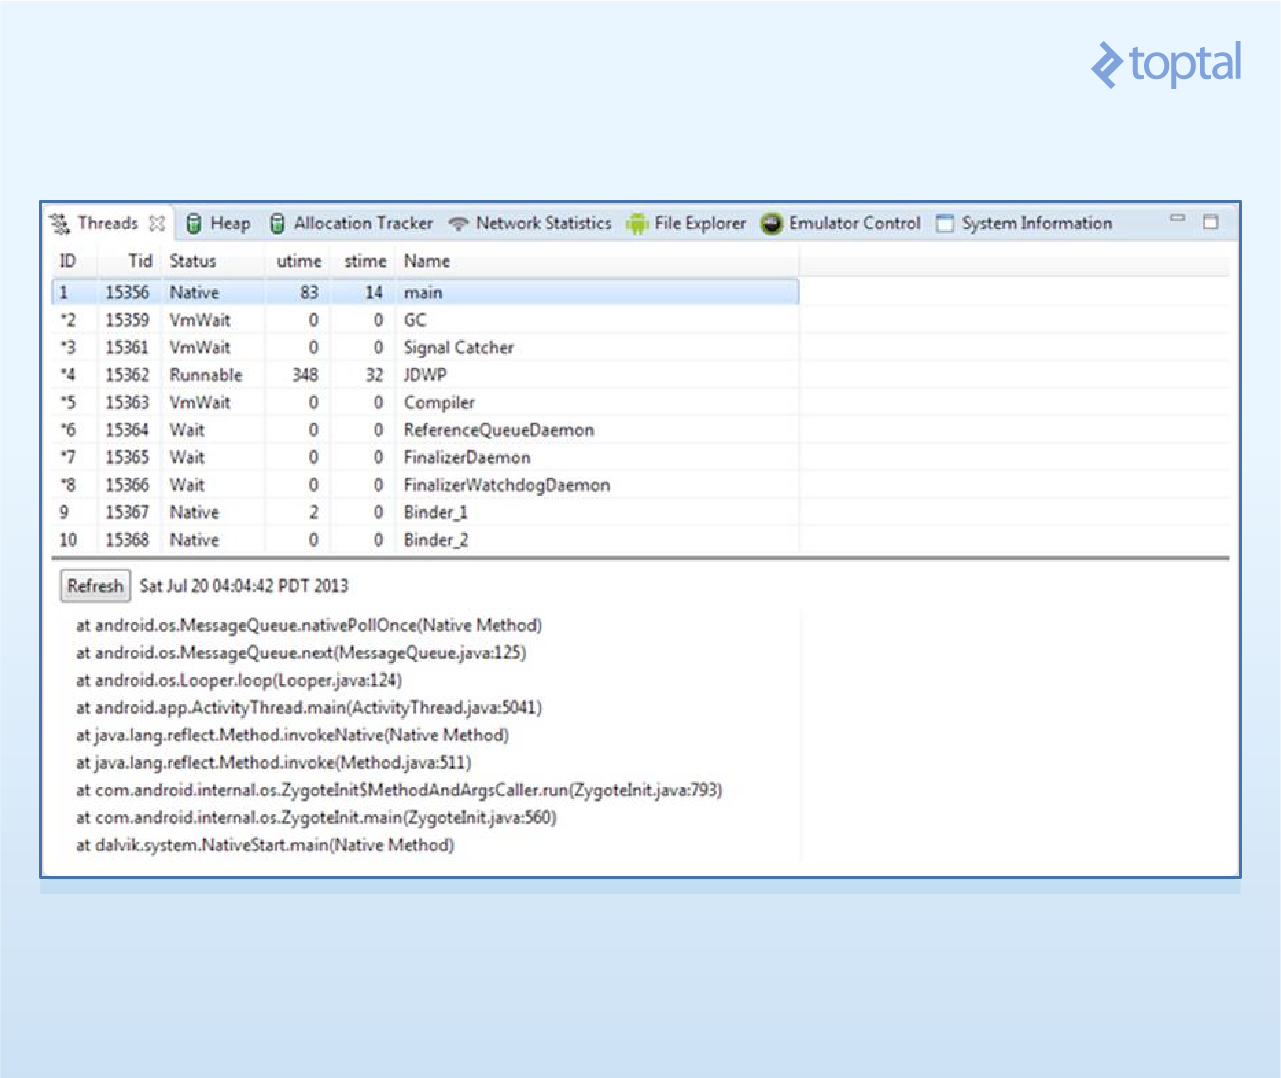
Upon entering the thread view, you’ll see a list of thread records, each displaying the thread’s name, ID, and two counters: utime and stime. Utime measures the total time the thread spends executing user code (your functions and third-party libraries), while stime tracks time spent on system code (sleep, synchronize, system calls). We’re usually more interested in utime, though stime can also highlight specific problems.
Let’s say our code is running, including several threads, and we want to ensure each thread gets its fair share of CPU time. To do this, we let the system run for a while, open the thread tab, and look for unusual utime values. Zero might indicate a problem—the thread received no CPU time. Conversely, very high values could signify another aspect of the same issue: threads with such high priority that others are starved.
Note that for I/O-bound threads (those primarily performing network or disk/database access), near-zero utime values aren’t necessarily problematic. These threads typically spend most of their time waiting for data or blocking on system calls, neither of which increments the utime counter. It’s crucial to understand your threads!
Tip: Never rely on default thread names. They’re meaningless and difficult to locate in DDMS views. Instead, when creating or fetching a thread from a thread pool, start by assigning it with a self-explanatory name. This significantly simplifies debugging and profiling. I usually prepend the app’s name to differentiate between Android-generated threads and those created by my code, for example: MyApp-server-connector, MyApp-db-interactor, etc.
Tip: A thread’s priority loosely determines its allocated CPU time. The priorities of your worker threads significantly impact your app’s overall performance and responsiveness, often making the difference between smooth, fast behavior and a sluggish, laggy experience. The rule is simple: Android’s default priority, NORMAL=5, is rarely ideal. For most worker threads, you want a smaller CPU footprint. To achieve this, at thread startup, set its priority to a lower value. I typically use priority=3.
Network Statistics Console
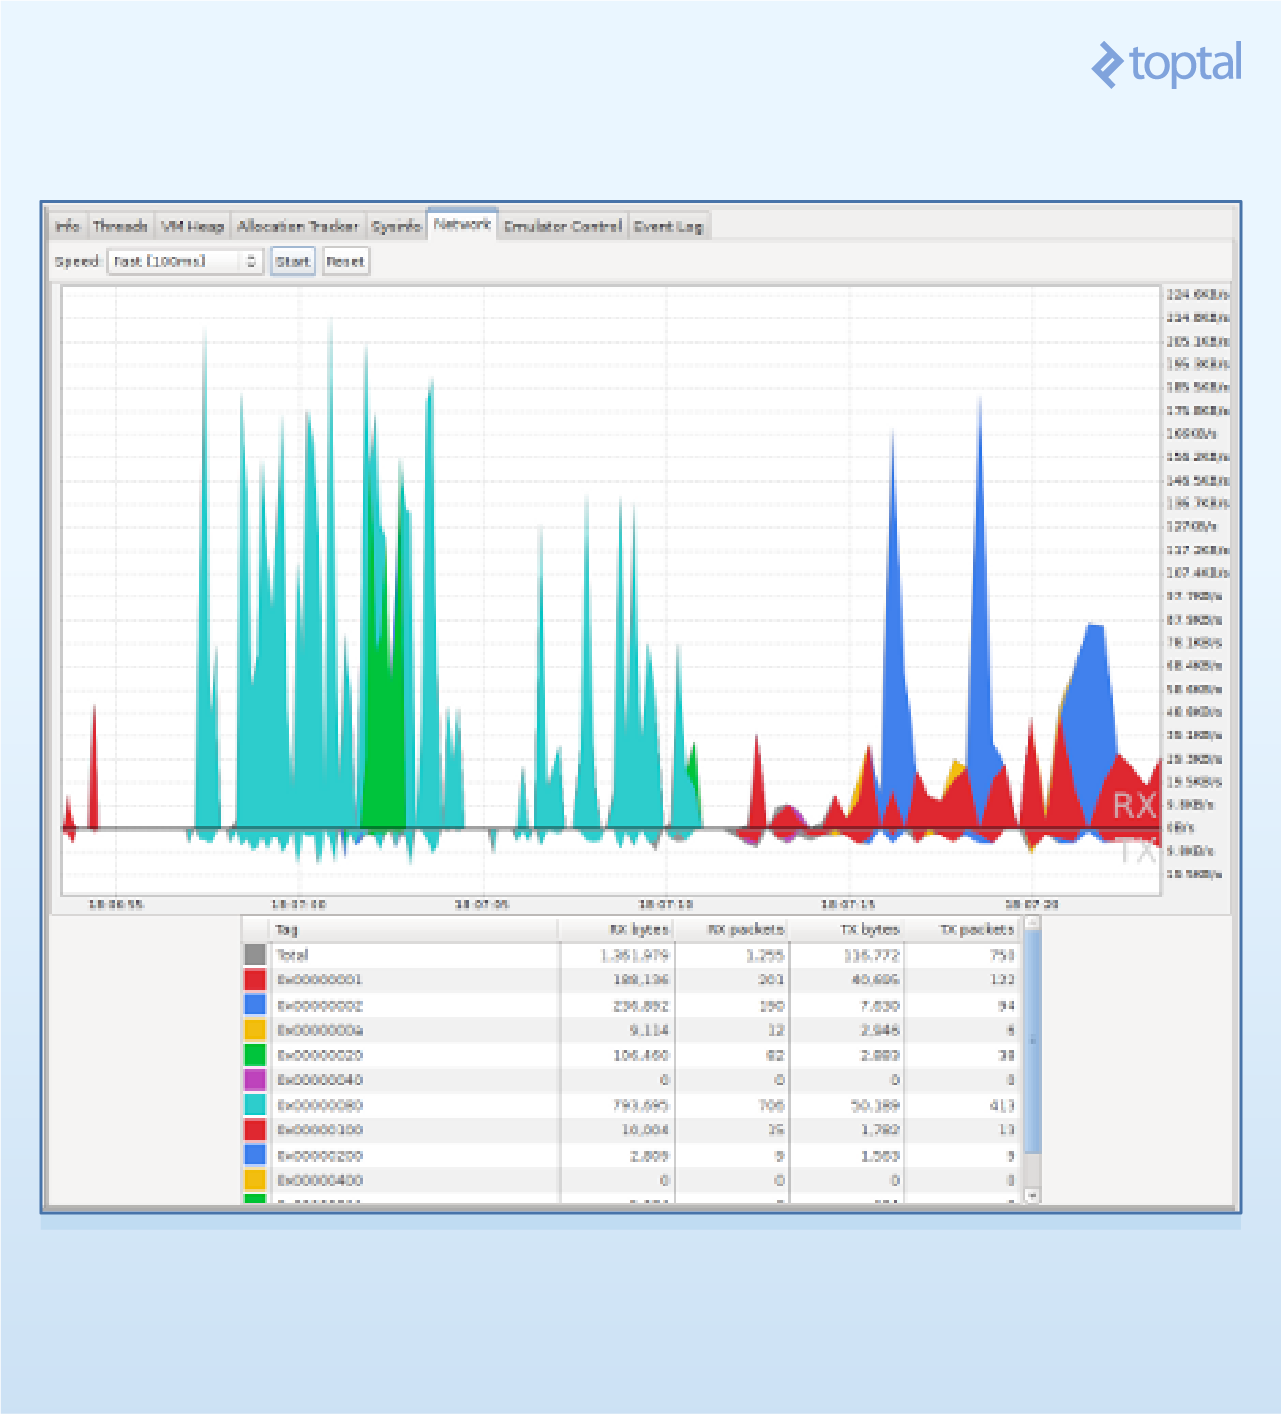
The network statistics console allows you to monitor your app’s incoming and outgoing communication in a relatively human-readable format.
The network chart’s y-axis represents the transmission speed in KB/second, while the x-axis represents elapsed time in seconds. To estimate a transmission’s size, approximate the area under the corresponding spike. This becomes easier with practice.
Remember that you need to click the upper “enable” button upon entering this console to start seeing network measurements.
Before this console’s development, developers often relied on sniffer apps (some still do) for similar information.
This console excels at visualizing a major battery-draining behavior: frequent small-packet communication. As many know, what truly drains your app’s battery isn’t five minutes of intense networking but rather prolonged periods of short, repetitive network requests, often for keepalives, diagnostics, or status updates.
Once you spot such a pattern, and the network console’s visual packet display makes it easy, immediately consider batching. Can you combine multiple small transmissions into a single larger one? This change can significantly improve your app’s battery consumption, moving it from a battery hog to a well-behaved application!
Tip: Never load images directly into memory. This is a recipe for an out-of-memory crash. Instead, perform scaled-down loading, or better yet, utilize a third-party library to handle the scaling for you.
While you’ll rarely need this information, remember that DDMS relies on the Android Debug Bridge (ADB) stack for device communication. If DDMS fails to display your app or freezes during a session, try opening a console and typing:
| |
This ensures your device is accessible and authorized with ADB. If not, restarting your local ADB server often resolves the issue:
| |
If problems persist and your app is on a physical device, try disconnecting all emulators. This is because DDMS connects to both physical devices and emulators, defaulting to the latter.
Real-world DDMS Example: An app freezes (doesn’t crash, just stops responding). The user quickly connects the device to a workstation, opens DDMS’s thread view, and examines the thread stack » identifies the problematic thread » reviews the stack trace—in this case, revealing a synchronization deadlock that was easily resolved after being identified.
Tip: If your app needs more RAM than Android’s default allocation, as with media-intensive apps, you can gain around 15-20% additional memory on most devices by enabling the _largeHeap manifest flag: https://developer.android.com/guide/topics/manifest/application-element.html_
Simulating Device States in Android DDMS
Mobile apps aren’t typically linear. They employ awareness strategies to monitor and respond to changes in the device’s state. For example, an app can listen for incoming calls or text messages, adapt to network changes, and track and react to location updates.
A simple example is a GPS app. While most of us don’t develop such apps (the market isn’t vast enough…), we often implement location-dependent logic, whether it’s a basic map displaying the user’s current position, route tracking, or location-sensitive data display.
Testing such state-dependent scenarios is notoriously complex, sometimes more so than writing the actual code. With a physical device and a SIM card, you can make and receive calls and SMS messages. Altering the device’s telephony status is more challenging but doable. Testing location changes can be trickier, although carrying your laptop around town is an option…
But what about emulator instances? How can we test these scenarios on them?
Once again, DDMS comes to the rescue. One of its powerful yet often overlooked features is the ability to simulate (“spoof”) mock events into a running emulator. DDMS can simulate incoming calls, send SMS messages, modify telephony status data, and more.
These simulated events are indistinguishable from real events within the emulator, as if received from actual hardware sensors. Specifically, all relevant app receivers will be triggered just as they would upon receiving a genuine call or SMS message.
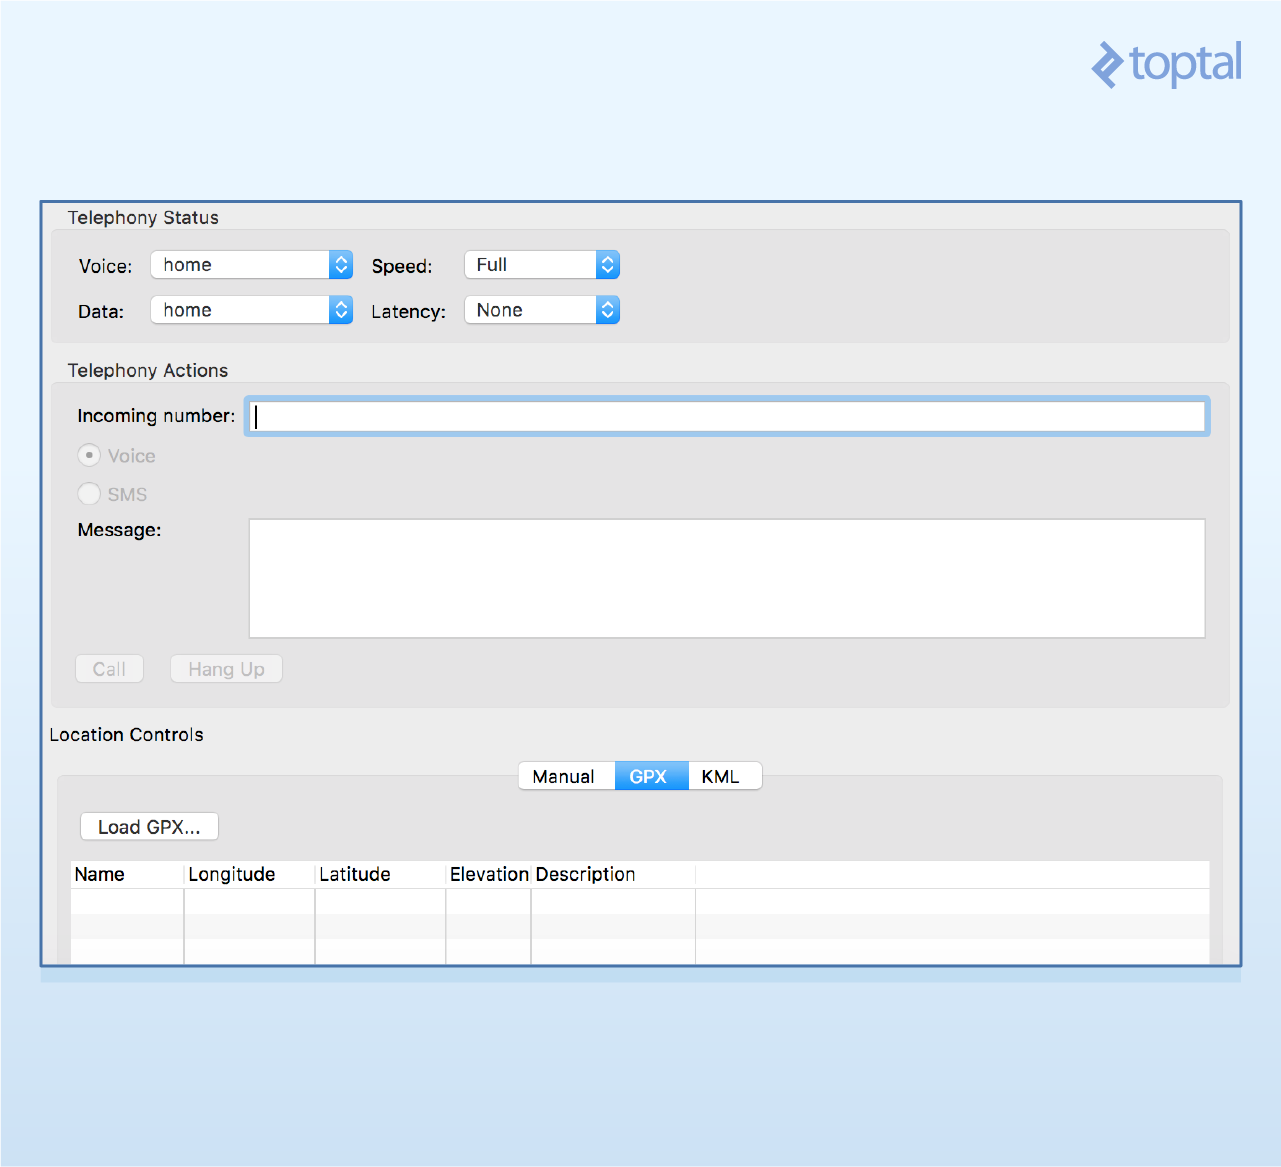
Simulating telephony status and actions is relatively straightforward:
To test your app’s behavior under poor network conditions (essential for any network-centric app), go to the Telephony Status section and adjust the speed and latency values. I usually use the GPRS values for both to emulate low connectivity, but feel free to experiment.
To simulate phone calls or SMS messages, go to the Telephony Action section, enter the originating phone number, add a text message if needed, and fire away. This is particularly useful for testing dedicated code paths for international calls without incurring actual charges.
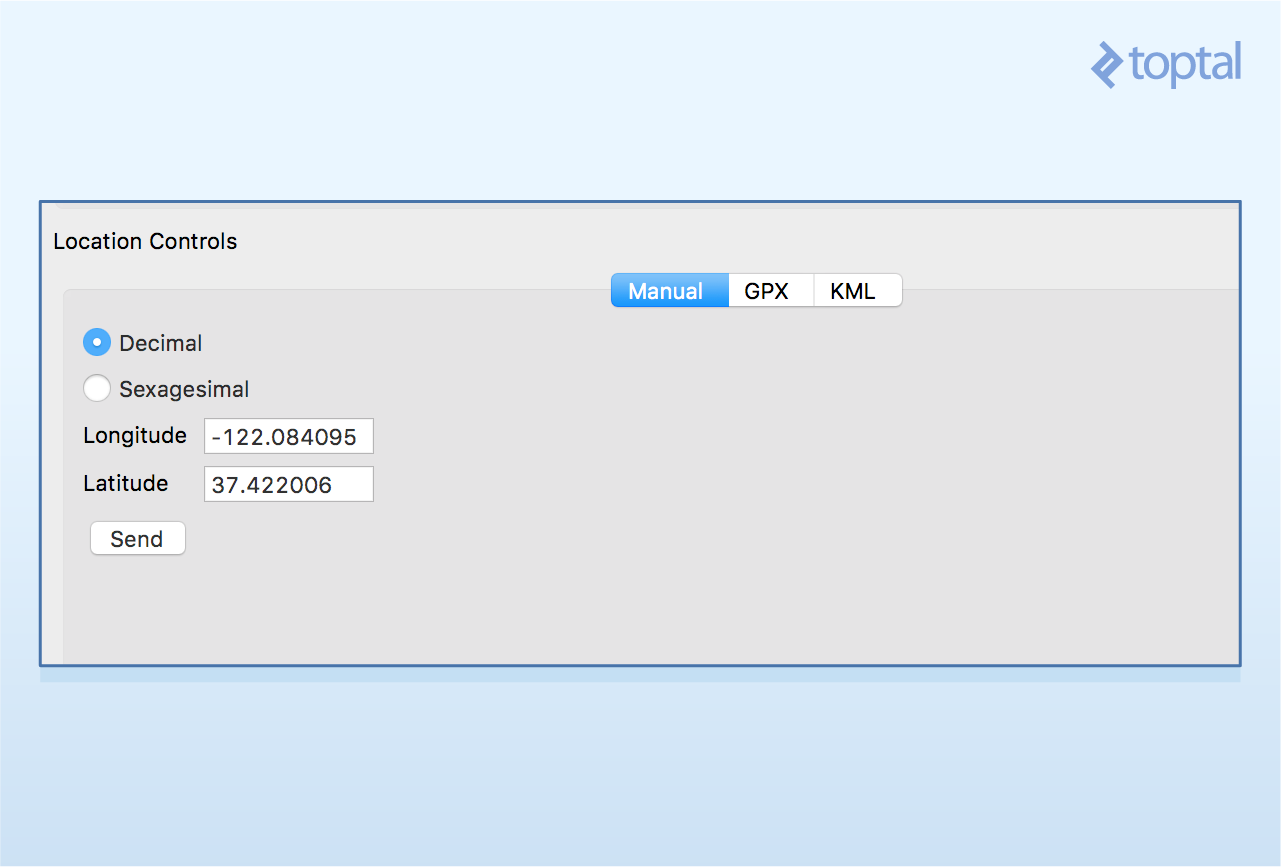
Simulating location changes is where things get more interesting.
To set a fixed location for your emulator, select Manual, enter the desired latitude and longitude values, and click Send.
But what if, instead of a fixed location, you want to simulate a pre-defined route—for instance, to see how your app behaves as the user travels between cities? This test is invaluable for map-based apps and other location-sensitive apps that adjust their data windows based on the user’s location. You’d want to ensure that location updates at varying speeds keep the displayed data window current.
For this, we’ll utilize KML, a format designed for use with Google Earth that represents routes or paths as a series of connected points in space, which GPS-enabled devices can interpret.
GPX is another path format supported by DDMS. For our purposes, consider them interchangeable for mobile location spoofing.
Let’s walk through the steps of setting up a mock route in the emulator.
- Create a route. The easiest way is using Google Maps’ directions feature, specifying the starting and ending points.
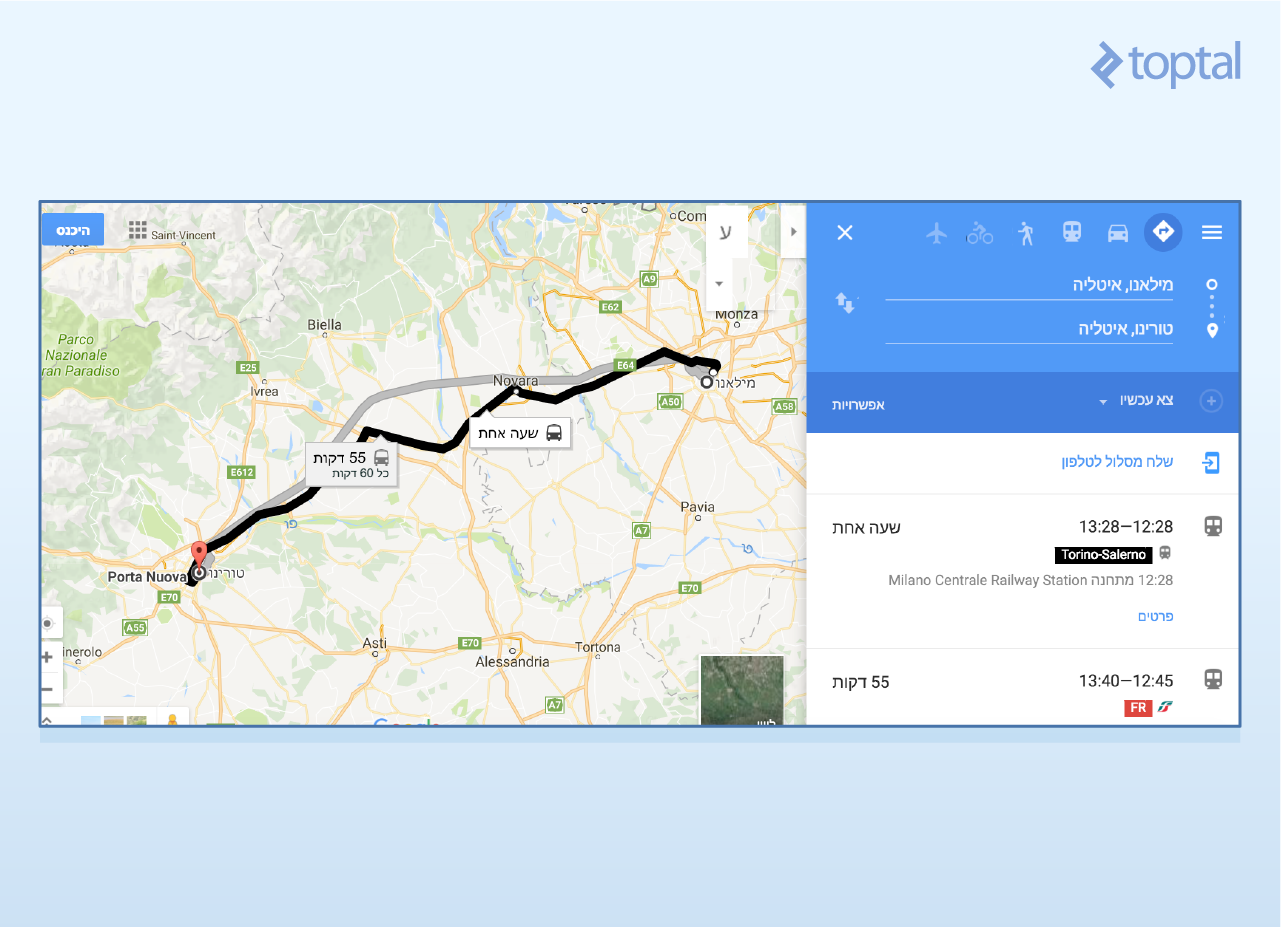
Once the route appears on the map, copy the URL from the address bar.
Go to the GPS Visualizer, paste the copied URL into the “Provide URL” field, and click the Convert button:
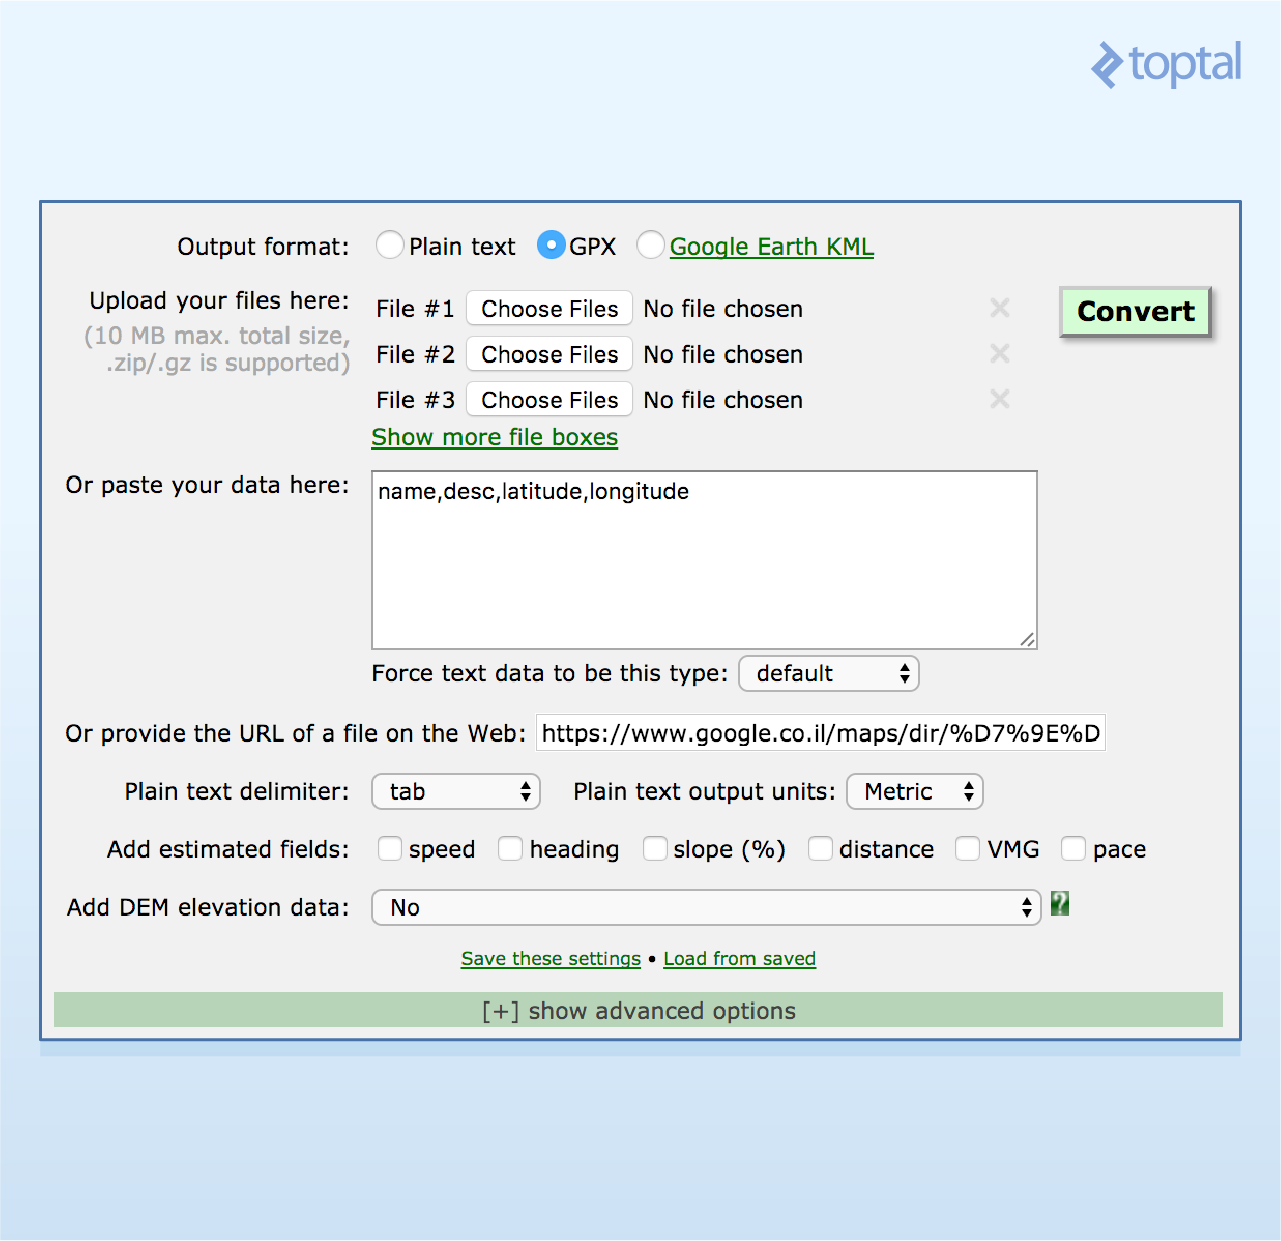
Then, download the resulting GPX file (which might have a slightly messy name, like 20170520030103-22192-data.gpx).
- Back in DDMS’s Location Control, open the GPX tab, click Load GPX, and select the downloaded file.
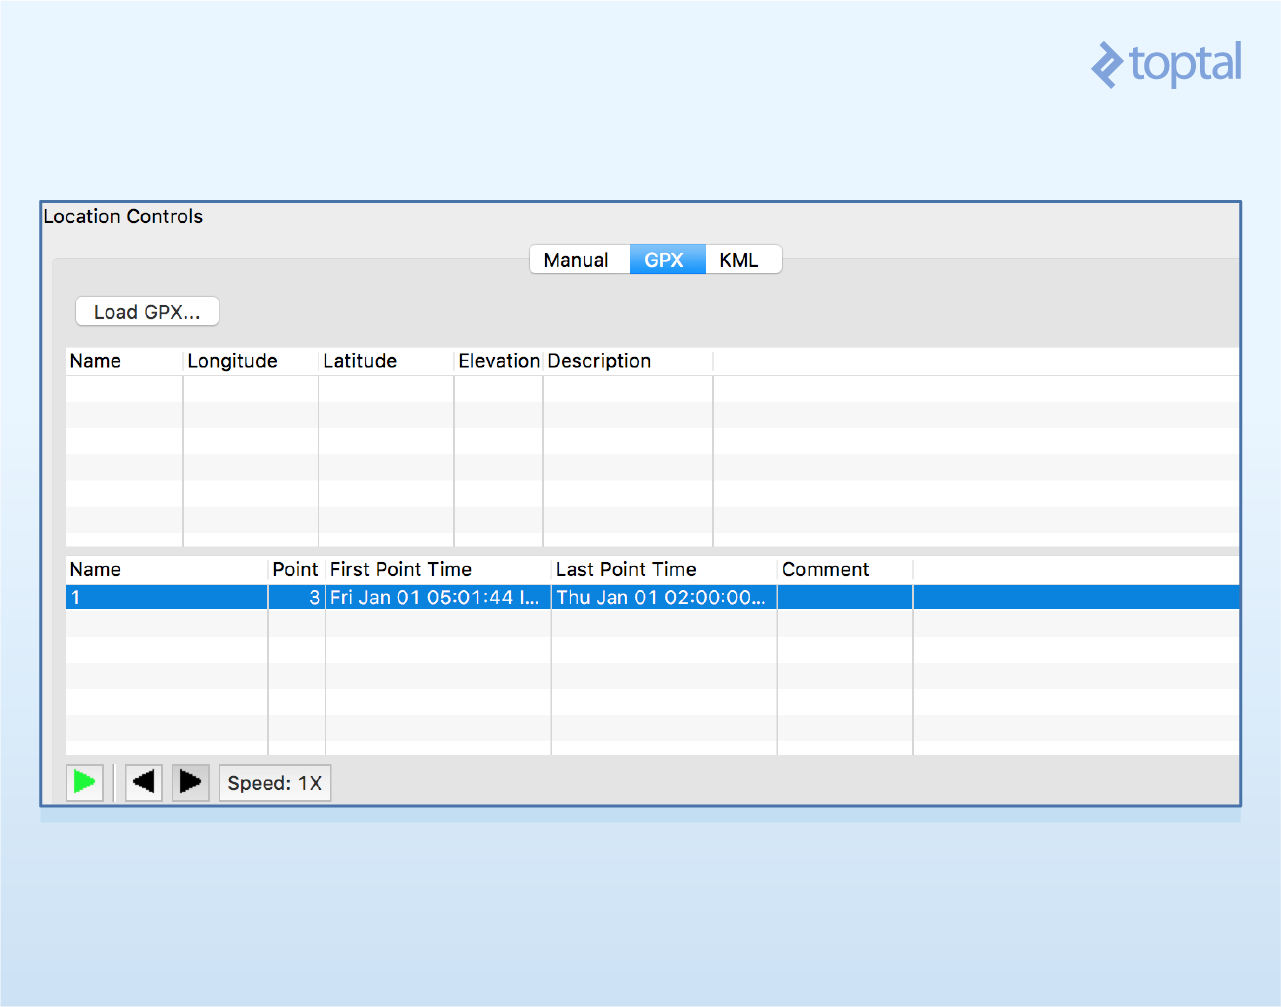
- You’re done! You can now navigate through the route’s waypoints by clicking the back and forward buttons or use the Play button to automatically traverse the route at a set speed.
You don’t have to create your own routes. Numerous websites offer downloadable routes, such as OpenStreetMap (see the ‘GPS Traces’ section).
Finally, note that unlike older DDMS versions, where loading route files was straightforward, newer versions might require some trial and error.
For instance, only GPX 1.1 seems to be supported. Newer versions might need manual adjustments.
Additionally, the GPX waypoint format is no longer supported. Use the GPX Track format instead:
| |
Debugging Android: An Hour a Week Makes a Difference!
Enough theory! It’s time for some practice. If you’re an Android developer, I encourage you to dedicate just one hour per week to exploring your app’s performance using DDMS.
You’ll be amazed by the amount of valuable information (information you can immediately use to improve your app) you’ll gain!
As I’ve witnessed firsthand with novice developers, Android DDMS is a tool that can significantly enhance a developer’s capabilities when mastered and utilized effectively. An Android developer’s ability to deliver top-tier systems will noticeably improve once they harness DDMS’s full potential. Therefore, dedicating a few hours to mastering DDMS is a wise investment that can drastically improve Android performance and efficiency.
Join the ranks of savvy developers. Use it.