A primary focus for Toptal’s engineering team is shifting towards a service-oriented architecture. A key part of this initiative was Billing Extraction, a project focused on decoupling billing functions from the main Toptal platform into a standalone service.
We’ve extracted the initial functionality over the last few months. For integrating billing with other services, we utilized both an asynchronous API (Kafka-based) and a synchronous API (HTTP-based).
This article documents our journey optimizing and stabilizing the synchronous API.
Step-by-Step Progress
This marked the first phase of our initiative. Our goal throughout the full billing extraction is to operate incrementally, deploying small, safe changes to production. (For more on another aspect of this project: extracting an engine from a Rails app incrementally, see slides from an excellent talk.)
We began with the Toptal platform, a monolithic Ruby on Rails application. Our initial step was pinpointing the divisions between billing and the platform at the data level. Our first strategy involved substituting Active Record (AR) relationships with standard method calls. Subsequently, we needed to establish a REST call to the billing service, retrieving data returned by the method.
We launched a compact billing service that accessed the same database as the platform. This setup enabled us to query billing via either the HTTP API or direct database calls. This approach provided a safety net; if the HTTP request encountered any issues (implementation errors, performance bottlenecks, deployment problems), we could utilize a direct call and provide the correct result to the caller.
To ensure smooth and safe transitions, we used a feature flag for toggling between HTTP and direct calls. Regrettably, this initial REST-based implementation proved exceedingly slow. Replacing AR relations with remote requests alone led to crashes when HTTP was activated. Even limiting its activation to a small percentage of calls couldn’t resolve this issue.
We recognized the need for a fundamentally different strategy.
The Billing Internal API (B2B)
Opting for enhanced client-side flexibility, we decided to replace REST with GraphQL (GQL). Our goal was to base our decisions during this transition on data, enabling us to anticipate outcomes this time.
To achieve this, we instrumented each request from the Toptal platform (monolith) to the billing service. This involved logging detailed information: response times, parameters, errors, and even stack traces (to understand which platform components were using billing). This allowed us to identify hotspots - code sections generating numerous requests or causing slow responses. Using stack traces and parameters, we could replicate issues locally and establish a tight feedback loop for numerous fixes.
To prevent unwelcome surprises in production, we incorporated an additional layer of feature flags. We designated one flag per API method to manage the transition from REST to GraphQL. This allowed us to enable HTTP incrementally while monitoring the logs for any “red flags.”
In most scenarios, these “red flags” manifested as prolonged response times (multiple seconds), 429 Too Many Requests errors, or 502 Bad Gateway errors. We tackled these problems using various patterns: data preloading and caching, limiting data fetched from the server, introducing jitter, and implementing rate-limiting.
Preloading and Caching
The first issue we encountered was a surge of requests originating from a single class/view, similar to the N+1 problem in SQL.
Active Record preloading proved ineffective across the service boundary, resulting in a single page dispatching approximately 1,000 requests to the billing service with each reload. Imagine, a thousand requests from just one page! The situation wasn’t much better with certain background jobs. Our preference was to handle dozens of requests, not thousands.
One of these background jobs involved fetching job data (let’s call this model Product) and determining if a product should be flagged as inactive based on billing data (for this example, we’ll refer to the model as BillingRecord). While products were fetched in batches, the billing data was requested each time it was needed. Since every product required billing records, processing each product individually triggered a request to the billing service. This translated to one request per product, culminating in roughly 1,000 requests sent from a single job execution.
Our solution involved incorporating batch preloading of billing records. For every batch of products retrieved from the database, we made a single request for billing records and then assigned them to their respective products:
| |
By implementing batches of 100 and limiting it to one request to the billing service per batch, we successfully reduced the requests from ~1,000 to ~10 per job.
Client-side Joins
Batching requests and caching billing records worked well when we had a collection of products and needed their billing records. But what about the reverse scenario: fetching billing records and then utilizing their corresponding products, which are retrieved from the platform database?
As anticipated, this resulted in another N+1 problem, this time on the platform side. When using products to gather N billing records, we were executing N database queries.
The solution involved fetching all necessary products simultaneously, storing them in a hash indexed by ID, and then assigning them to their corresponding billing records. Here’s a simplified illustration of the implementation:
| |
If you find this reminiscent of a hash join, you’re not alone.
Server-side Filtering and Underfetching
We successfully mitigated the most severe request spikes and N+1 problems on the platform side. However, slow responses persisted. We traced these back to excessive data loading onto the platform and subsequent filtering (client-side filtering). Loading data into memory, serializing, transmitting it over the network, and then deserializing only to discard most of it was incredibly wasteful. This approach, while convenient during implementation due to generic, reusable endpoints, proved impractical during operation. A more tailored approach was necessary.
We addressed this by adding filtering arguments to GraphQL. Our strategy mirrored a well-established optimization: shifting filtering from the application layer to the database query (find_all vs. where in Rails). In the realm of databases, this approach is straightforward, achieved using WHERE in the SELECT query. In our case, it necessitated handling query processing ourselves (within Billing).
After deploying these filters, we anticipated a performance boost. Instead, we were greeted with 502 errors on the platform (errors that unfortunately extended to our users). Not good. Not good at all!
What went wrong? The change was intended to enhance response times, not disrupt the service. We had inadvertently introduced a subtle bug. Our setup retained both versions of the API (GQL and REST) on the client side. The transition was being managed gradually using a feature flag. Unfortunately, the initial version we deployed introduced a regression within the legacy REST branch. Our testing had primarily focused on the GQL branch, causing us to overlook the performance issue in REST. Lesson learned: if search parameters are absent, return an empty collection, not the entirety of your database.
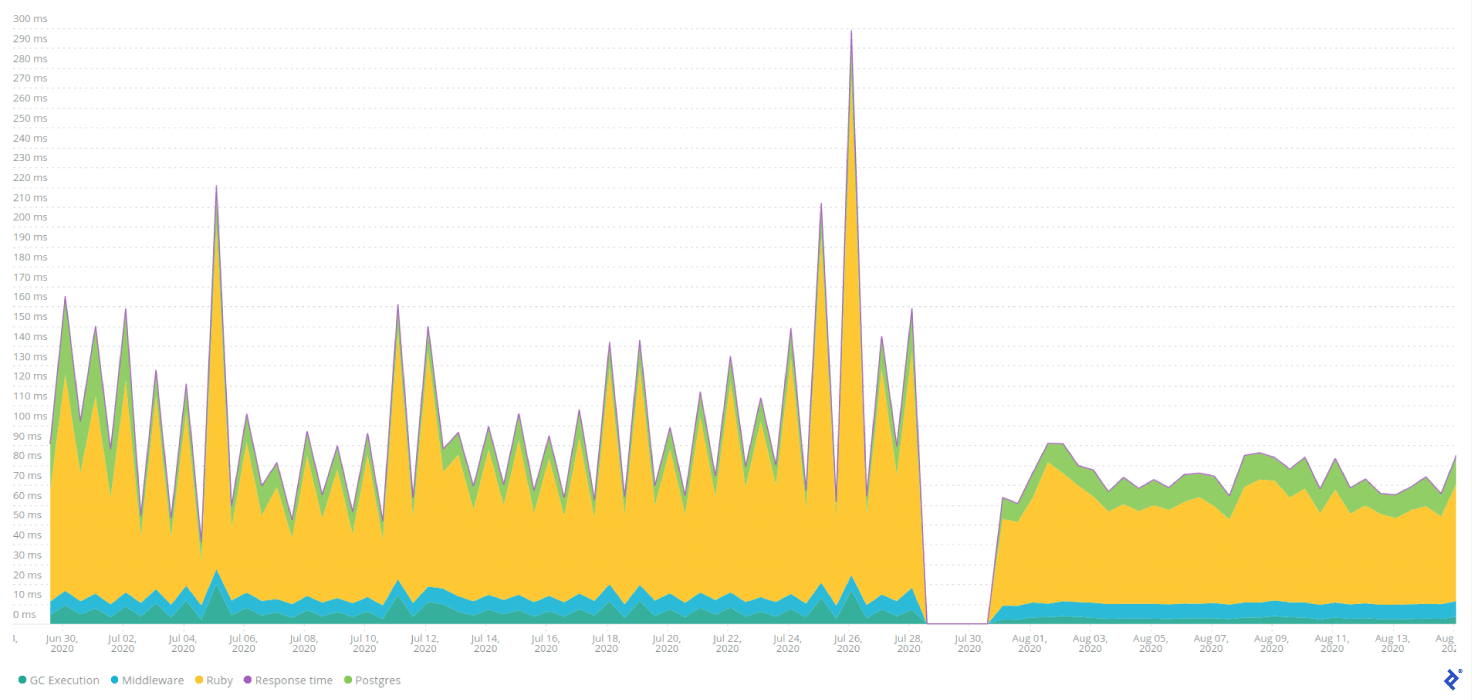
Observe the NewRelic data for Billing. We deployed the changes incorporating server-side filtering during a period of low traffic (billing traffic was disabled following the platform issues). Notice how responses become faster and more predictable after deployment.
Incorporating filters into the GQL schema proved relatively straightforward. The instances where GraphQL truly shone were those involving the retrieval of excessive fields, not an excessive number of objects. With REST, we were transmitting all potentially necessary data. The creation of a generic endpoint forced us to include all data and associations used on the platform.
With GQL, we gained the ability to select specific fields. Instead of fetching over 20 fields, which entailed loading multiple database tables, we could choose only the essential three to five fields. This effectively eliminated sudden spikes in billing usage during platform deployments, as some of those queries were utilized by ElasticSearch reindexing jobs run during deployment. An added bonus was faster and more reliable deployments.
The Fastest Request Is the One You Don’t Make
Having limited the number of fetched objects and the data packed within each object, we explored further optimization avenues. Could we, perhaps, not fetch the data at all?
We identified another area for improvement: the frequent use of the creation date of the last billing record on the platform. Each time, a call was made to the billing service to retrieve this data. Instead of fetching it synchronously on demand, we considered caching it based on events sent from the billing service.
We meticulously planned, prepared tasks (four to five), and got to work, aiming for swift completion given the significant load generated by these requests. We estimated a two-week development timeframe.
Fortunately, shortly after commencing, a fresh perspective on the problem revealed that we could leverage existing data on the platform, albeit in a different format. Instead of introducing new tables for caching data from Kafka, we dedicated a couple of days comparing data between the billing service and the platform. We also sought input from domain experts regarding the feasibility of utilizing platform data.
Ultimately, we replaced the remote call with a DB query. This decision resulted in a significant victory, both in terms of performance and workload reduction. It also saved us over a week of development time.
Distributing the Load
Despite implementing and deploying these optimizations incrementally, there were still instances of the billing service responding with 429 Too Many Requests. While we could have increased the request limit on Nginx, we opted for a deeper understanding of the issue, considering it an indicator of unexpected communication patterns. Recall that these errors on production were acceptable due to the fallback mechanism (direct call), rendering them invisible to end-users.
The error consistently surfaced on Sundays, coinciding with the platform’s scheduling of reminders for talent network members regarding overdue timesheets. Sending these reminders involved a job fetching billing data for relevant products, which encompassed thousands of records. Our initial optimization steps involved batching and preloading billing data and retrieving only the necessary fields. As these are well-established techniques, we won’t delve into detail here.
Confident in our solution, we deployed and eagerly awaited the following Sunday. However, the error resurfaced.
The billing service was being called not only during reminder scheduling but also during the actual sending of reminders to network members. Since reminders were dispatched through separate background jobs (utilizing Sidekiq), preloading was not an option. We had initially dismissed this as a non-issue, assuming that not every product would require a reminder and that reminders would be sent out in a consolidated manner. The scheduled time for reminders was 5 PM in the network member’s respective time zone. However, we had overlooked a crucial detail: the non-uniform distribution of our members across time zones.
We were scheduling reminders for thousands of network members, with approximately 25% residing in a single time zone and another 15% in the second most populous time zone. As the clock struck 5 PM in these time zones, we were hit with the task of sending hundreds of reminders simultaneously. This translated to a burst of hundreds of requests to the billing service, exceeding its capacity.
Preloading billing data was not feasible due to reminders being scheduled via independent jobs. We couldn’t reduce the number of fields fetched from billing, as we had already optimized this aspect. Relocating network members to less populated time zones was not a viable option either. So, what did we do? We shifted the reminders, ever so slightly.
By adding jitter to the reminder scheduling time, we prevented all reminders from being sent at the exact same moment. Instead of a strict 5 PM schedule, we introduced a two-minute window, between 5:59 PM and 6:01 PM.
Confident in our fix, we deployed the service and waited for the following Sunday. However, Sunday arrived, and so did the error.
Perplexed, we revisited our calculations. The requests should have been distributed over a two-minute interval, resulting in a maximum of two requests per second, a load well within the service’s capabilities. Analyzing the logs and timings of billing requests revealed a flaw in our jitter implementation, causing requests to remain clustered.
What was the root cause of this behavior? The answer lay in Sidekiq’s scheduling mechanism. It polls redis every 10–15 seconds, preventing it from achieving one-second resolution. To ensure uniform request distribution, we turned to Sidekiq::Limiter - a class provided by Sidekiq Enterprise. Specifically, we employed the window limiter, which allowed a maximum of eight requests within a moving one-second window. This value was chosen based on our Nginx limit of 10 requests per second on the billing service. The jitter code was retained for its coarse-grained request dispersion, distributing Sidekiq jobs over a two-minute period. Subsequently, Sidekiq Limiter ensured that each group of jobs was processed without exceeding the defined threshold.
With renewed confidence, we deployed the solution and braced ourselves for Sunday. This time, our efforts were rewarded. The error vanished.
API Optimization: Nothing New Under the Sun
You’re likely unsurprised by the solutions we employed. Batching, server-side filtering, transmitting only essential fields, and rate-limiting are not groundbreaking techniques. Seasoned software engineers have undoubtedly utilized these in various contexts.
Preloading to prevent N+1 issues? A staple in every ORM. Hash joins? Even MySQL has embraced them. Underfetching? The age-old trick of SELECT * vs. SELECT field. Load spreading? Another familiar concept.
So, why this article? Why not do it right from the start? As always, context is paramount. Many of these techniques only became apparent after implementation or after encountering a production issue demanding a solution. They weren’t immediately obvious from simply staring at the code.
Several factors contributed to this. In most instances, we prioritized the simplest workable solution to avoid over-engineering. We began with a straightforward REST solution, later transitioning to GQL. Changes were deployed behind a feature flag, meticulously monitored with a fraction of traffic, and iteratively improved based on real-world data.
One key takeaway was the ease with which performance degradation can be overlooked during refactoring (with extraction being a significant refactoring). Introducing a strict boundary inadvertently severed optimizations introduced earlier in the code. This only became evident through performance measurements. Lastly, replicating production traffic in our development environment proved impossible in some cases.
Our initial pursuit of a minimal, universal HTTP API for the billing service resulted in numerous generic endpoints/queries carrying data for various use cases. Consequently, much of this data was irrelevant in many scenarios. This highlighted a subtle conflict between the tradeoff between DRY and YAGNI principles. DRY promotes a single endpoint/query for retrieving billing records, while YAGNI cautions against unused data in endpoints, which can hinder performance.
Discussions about jitter with the billing team also revealed another trade-off. From the client’s (platform) perspective, every request should receive a timely response, abstracting performance issues and server overload behind the billing service. Conversely, from the billing service’s perspective, making clients aware of server performance characteristics is crucial for load management.
Again, no groundbreaking revelations here. It’s about recognizing familiar patterns in different contexts and understanding the trade-offs associated with each change. We learned this through experience and hope to spare you from repeating our mistakes. Instead of replicating our errors, you’ll undoubtedly make your own and learn from them.
Special thanks to our colleagues and teammates who contributed to this endeavor: