Maps are incredibly valuable tools. These days, navigating online maps is a breeze. Creating your own online maps is no longer a daunting task, thanks to the wide array of web-based mapping tools at our disposal, ranging from user-friendly free options to more intricate and feature-rich ones. For web developers venturing into the world of web mapping, the sheer number of choices can be overwhelming. You’re eager to make maps but unsure where to begin or which tools are right for the job. That’s where I come in – with this guide to the top mapping tools available.
A Glimpse into Mapping History
Technology has always played a role in how maps are made and used. As technology advanced, so did cartography and mapmaking, evolving from maps painstakingly drawn on papyrus to the interactive maps we see online.

The latter half of the 20th century marked a turning point. Computers became indispensable, while aerial photography, satellite imagery, and remote sensing transformed how we collect spatial data. Geographic Information Systems Geographic Information Systems (GIS) emerged. Gradually, GIS maps transitioned from desktops to the web, with major GIS providers introducing the initial frameworks for online mapping.
However, GIS mapping is no simple feat. It demands a deep understanding of various server-side technologies, geospatial standards, and protocols, as well as their practical applications. It requires expertise in handling geospatial data, map projections, data collection, data visualization, color schemes, data generalization across different scales, map labeling, server setup for map hosting, spatial database management, and more. GIS is rife with abbreviations – WMS, WFS, EPSG, CRS, SLD, GML, TMS, just to scratch the surface. Getting to grips with these requires delving into books, scholarly papers, and countless articles.
The Rise of Online Mapping
Early web maps were typically limited to displaying a single, small map image. Panning involved moving in fixed increments, often half the map size, in one of eight cardinal directions (N, NW, W, SW, S, SE, E, NE). Each click of the pan or zoom button triggered the map server to render a whole new image, transmit it over the network, and then have the browser process it. Due to technological limitations back then, maps occupied only a tiny fraction of a web page. To achieve better interactivity, these early maps often relied on plugins like Flash, Java-based proprietary plugins, or even ActiveX, which only functioned within Internet Explorer.
Google revolutionized the mapping landscape with the introduction of Google Maps in 2005. Among its groundbreaking features, Google introduced continuous panning by dragging. Their solution involved dividing a map into numerous smaller square images known as “tiles.” Rendered and served from a “map tile server,” these tiles were usually 256 x 256 pixels in size. Zooming and panning now simply required loading the relevant map tiles, eliminating the need to reload the entire web page. The outcome was a larger, more prominent map that covered a significant portion of the browser window, providing a seamless map exploration experience. Thanks to the ability to smoothly drag the map and effortlessly zoom in and out, these new maps were dubbed “slippy maps.” Google also enabled scripting, empowering users to integrate Google Maps into their websites and overlay their own data – giving rise to the term “map mash-ups.”
Online maps surged in popularity. You no longer needed to be a cartographer or a GIS guru to add an attractive map to your site. Fueled by the “Web 2.0” movement and built upon modern technologies like HTML5, CSS3, and SVG, which streamlined the creation of interactive content, interactive maps experienced a resurgence.

Map Data
As previously mentioned, the foundation of early online maps was sets of GIS data and their associated spatial geodatabases. Accessing such data was limited to a select few, not to mention the often-prohibitive costs involved. However, Google and the emergence of the OpenStreetMap (OSM) project datasets transformed this landscape. Google’s database remains private and comes with certain restrictions. On the other hand, OSM, drawing inspiration from Wikipedia, was envisioned as a collaborative endeavor to create a free, globally accessible map. OpenStreetMap thrives on the contributions of a volunteer mapper community who contribute to and maintain the spatial data.
In essence, the most significant factor that simplified modern mapmaking is the elimination of the complexities associated with maintaining a dedicated map server and spatial database.
Selecting the Right Web Mapping Framework
With so many options at our fingertips, how do we go about choosing the ideal online mapping tool? On one side, we have commercial online map providers like Google, MapQuest, Microsoft, and Nokia. These services offer map tiles and proprietary JavaScript APIs for map viewing and interaction. On the other side are open-source mapping projects that facilitate the effortless loading of OpenStreetMap-based map tiles. These include OpenLayers and Leaflet. Then we have projects such as MapBox and CartoDB, which build their business models upon open-source libraries and OSM data, offering value-added services but not without a price tag.
Let’s delve into examples from each of these categories. I’ll provide a concise overview of several of these online mapping tools, accompanied by code snippets to illustrate their implementation. We’ll also weigh the pros and cons of each. For a deeper dive into D3.js mapping, we have a dedicated D3.js mapping tutorial that you might find insightful.
Google Maps
Let’s begin with the most prominent choice – Google Maps. The inaugural version of the Google Maps API was launched in February 2005, followed by the current Google Maps API v3 in June 2009. The Google Maps API encompasses more than just the JavaScript API endpoint; it encompasses a range of projects and provides numerous ways to embed Google Maps into web pages with extensive customization options.
Current Google Maps APIs include:
- Google Maps Javascript API
- Google Static Maps API
- Google Maps Embed API
- Google Maps SDK for iOS
- Google Maps Android API v2
To help you select the appropriate API, Google has created an API picker.
It’s important to note that while the basic APIs are free to use, there are limitations. Firstly, maps must be freely and publicly accessible to end users. Secondly, usage is restricted – the service remains free as long as your website doesn’t generate more than 25,000 map loads each day, over any 90-day period. If you require larger scales, a private map, or are operating a commercial or enterprise-level website, you’ll want to consider paying for Google Maps API for Work.
Implementation Example
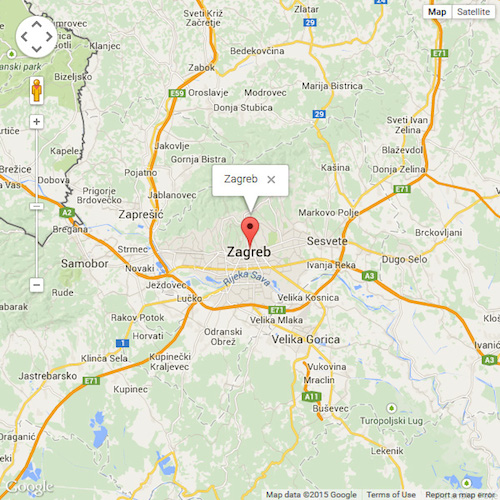
Let’s demonstrate how to implement a basic Google map using code. This example showcases the creation of a simple map using the API, placing a marker on the map, and displaying a popup upon a mouse click.
| |
Here’s what the resulting map looks like:
Advantages
- Backed by Google’s development and maintenance.
- A variety of APIs for integrating maps into websites and applications.
- A large and active user community.
- Comprehensive API documentation with ample examples.
Disadvantages
- The potential for future ad integration remains uncertain.
- The ubiquity of Google Maps can lead to a sense of visual homogeneity among maps.
- It’s a closed and proprietary API.
- Plugins are limited to those officially developed by Google.
- The pricing structure for Google Maps for Work can be unclear.
OpenLayers
OpenLayers was conceived by MetaCarta as an open-source counterpart to Google Maps. Its first version was released in June 2006. OpenLayers offers a JavaScript API for building sophisticated web-based geographic applications, mirroring the API structure of Google Maps. OpenLayers rapidly gained traction, with development progressing at a swift pace. OpenLayers 2 followed just two months later, in August 2006. Continuous development led to frequent new releases with added features. However, this rapid evolution had a drawback – the version 2 library grew bulky and complex, ballooning to 1MB in size and comprising over 100,000 lines of code! While it offered a plethora of features, not all of them were essential for average users.
This became the impetus for a complete library overhaul. The aim was to leverage the latest HTML5 and CSS3 capabilities while retaining the core functionality of OpenLayers 2, including support for projections, industry-standard protocols, and editing features. The primary focus was on enhancing performance, achieving lighter builds, creating more visually appealing components, and refining the API. This revamped version, much-improved OpenLayers 3, was released in August 2014.
Implementation Example
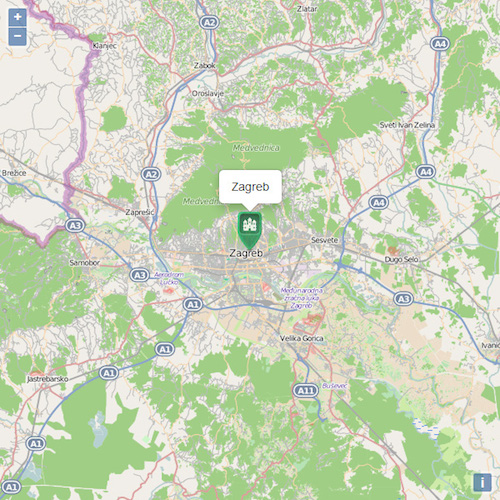
Let’s recreate the same map from the previous example using OpenLayers 3.
| |
Here’s how it looks:
Advantages
- Free and open-source nature.
- A comprehensive library catering to diverse mapping requirements.
- An abundance of examples.
- Support for a wide array of data types and GIS standards.
- Built-in capabilities for map projections and editing features.
Disadvantages
- Version 3 is still undergoing active development, with the API subject to change with every point release.
- The API syntax can be intricate.
- Version 3 documentation, while improving, is not as exhaustive as it could be.
Leaflet
It’s safe to say that Leaflet emerged as a response to the perceived bloat, complexity, and feature overload of OpenLayers. Vladimir Agafonkin was initially tasked with creating a wrapper around OpenLayers, but he opted to develop a streamlined and lightweight alternative, giving birth to Leaflet in May 2011. Vladimir’s primary focus was on simplicity, performance, and user-friendliness. The core library provides only essential functionality, which is sufficient for most real-world scenarios. However, Leaflet’s capabilities can be expanded using a vast collection of plugins that are straightforward to develop and integrate on top of the core library. Furthermore, Leaflet was designed from the ground up with mobile compatibility in mind.
Leaflet’s ease of use is complemented by well-structured documentation and clean, available on GitHub source code. Its emphasis on performance, usability, simplicity, small footprint, and mobile support makes it significantly less intricate compared to OpenLayers.
Leaflet’s future appears promising. According to Vladimir, the next major release aims to be even simpler, further boosting performance and enhancing the plugin infrastructure.
Implementation Example
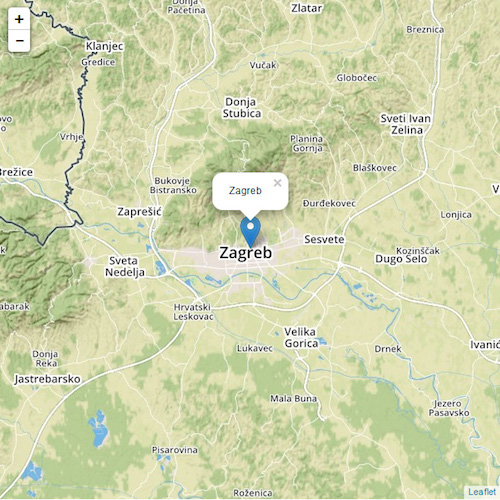
Once again, let’s implement the same map using Leaflet:
| |
The result:
Advantages
- Free and open-source nature.
- Small size and fast performance.
- Straightforward and easy-to-grasp API syntax.
- Mobile-friendly design.
- Ideal for quickly and effortlessly deploying online maps.
- A wealth of examples accompanied by excellent documentation.
Disadvantages
- Advanced functionality is somewhat limited.
MapBox
MapBox, a startup, is striving to revolutionize online cartography, aiming to create visually appealing and highly versatile online maps. The MapBox JavaScript API is built upon Leaflet as a Leaflet plugin, extending Leaflet’s capabilities and integrating with other MapBox web services. This includes MapBox hosting for user-generated custom maps and datasets. In addition to the JavaScript API, MapBox provides the following interconnected services:
- Mobile SDKs for iOS and Android.
- A collection of pre-designed maps.
- Static maps that can be displayed without requiring a mapping library.
- A dedicated GeoCoding service.
- A Directions service tool.
MapBox goes beyond offering just a mapping service – it also grants access to data, encompassing privately acquired satellite imagery, open data from NASA, and community-driven global data from OpenStreetMap. Data styling is accomplished using CartoCSS, a CSS and LESS-based style format developed by MapBox. While MapBox offers a free tier, it comes with limitations on bandwidth and storage. For more demanding use cases, a paid subscription is necessary.
Numerous prominent companies have recognized MapBox’s strengths and integrated it into their websites, including Foursquare, Evernote, Pinterest, The Financial Times, GitHub, and Etsy, among others.
CartoCSS
Here’s an example of a visually striking MapBox map utilizing a style called Pirates, crafted by MapBox’s designers. Since MapBox is built on Leaflet, embedding this map into your web page would involve code similar to the Leaflet example above:
As mentioned earlier, CartoCSS is used to style vector tiles within MapBox. This is facilitated by their MapBox Studio, which is also available as open source. MapBox Studio allows you to craft map styles from the ground up or modify and extend existing styles created by other designers. Once your custom map is uploaded to your MapBox account, you can effortlessly embed it into your site using the MapBox API.
Here’s a snippet of the CartoCSS used to achieve the Pirates baselayer:
| |
Ahoy, there!
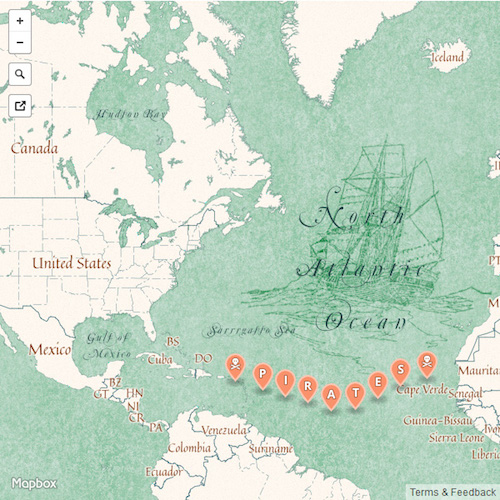
Feel free to explore other pre-designed MapBox styles here.
Advantages
- Extends the capabilities of Leaflet.
- Access to a vast repository of high-resolution, cloud-free satellite imagery.
- Detailed terrain data.
- A comprehensive suite of connected services.
- Visually stunning maps available out of the box.
- A graphical interface for styling and customizing existing maps.
Disadvantages
- The premium features come at a cost.
- The pricing model, Pricing, is primarily based on traffic rather than the number of features used.
CartoDB
When it comes to more intricate geospatial data visualization and analysis, CartoDB stands out as a top contender. It’s a cloud-based service that houses geographic data in a spatially enabled database called PostGIS, providing the tools to access, analyze (leveraging the spatial and geolocation capabilities of PostGIS), and visualize this data using Leaflet.
CartoDB emerged from a need for more accessible solutions for geospatial data visualization and storage. In many ways, it can be seen as an alternative to Google’s Fusion Tables. Users can import datasets in various formats, such as CSV, KML, or Excel tables, and overlay them on maps from sources like Google, Here (Nokia), or OpenStreetMap. Since the geodata is stored in a robust database, it can be accessed and queried using SQL and styled with CSS.
CartoDB follows a “freemium” model. Users who choose to make their data publicly accessible can host their projects on the CartoDB website for free. However, to store private data, import datasets exceeding 5MB, or utilize more than five tables, a paid premium plan is required.
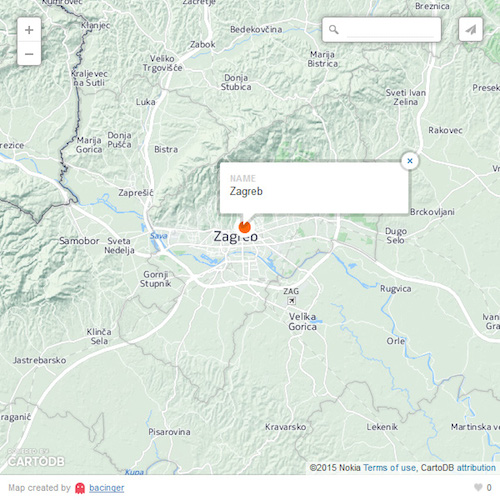
GeoJSON
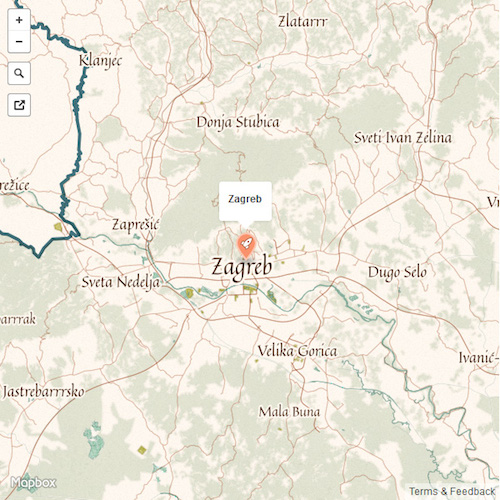
CartoDB excels at data visualization. Any data with georeferenced coordinates will be automatically visualized on the map. For instance, we can display a label for Zagreb simply by adding it to our PostGIS database. Here’s an illustration using GeoJSON formatting:
| |
To truly grasp CartoDB’s capabilities, take a look at their impressive collection of gallery.
Advantages
- Exceptional for managing and storing geospatial data.
- Supports a wide range of data formats and handles large datasets effectively.
- Built on the foundation of proven open-source projects like Leaflet and PostGIS.
- Offers a freemium model, making it accessible to a wider audience.
Disadvantages
- The service is not entirely free.
- The pricing structure, Pricing, is based on data storage size, which can become costly when working with very large datasets.
Additional Options for Web Developers
While we’ve covered the most popular mapping frameworks, other lesser-known options exist. If you’re operating within the Microsoft ecosystem, they provide an API akin to Google Maps called Bing Maps API.
We can’t overlook a veteran in the online mapping realm – MapQuest. It’s still actively maintained and offers a viable MapQuest Mapping Tools.
If you’re seeking a somewhat unconventional approach to map creation, Kartograph is worth exploring. It was specifically designed with the needs of designers and data journalists in mind.
Styling Your Maps
All the frameworks discussed offer ways to customize the style and appearance of your maps. MapBox and CartoDB facilitate styling using CSS or CSS variations.
Google Maps API v3 introduced custom styled maps, which empowers developers, especially designers, to customize the ubiquitous default Google Maps design and align it with a website’s overall visual theme. The vibrant Google Maps community has responded by creating resources for styling. One notable example is Snazzy Maps, a community-driven platform where users share custom Google Maps styles for free.
If you opt for OpenLayers or Leaflet, you’re limited to pre-rendered map tiles. However, there’s no shortage of map tile options to choose from – Google, Nokia, Bing, default OSM tiles, or designer-created options like Stamen. To get a sense of the sheer variety of available map tiles or compare their visual styles, websites like Streetmap Smackdown or Map compare are excellent resources.
The Future Landscape of Web Maps and Mapping Tools
The future of mapping holds exciting possibilities. Emerging technologies that were once the realm of science fiction are becoming a reality:
- Vector-Only Mapping: Utilizing vector maps instead of raster images, powered by technologies like D3.js, unlocks a world of features unattainable with standard frameworks. MapBox is embracing this direction with MapBox GL, which leverages OpenGL.
- 3D Mapping: Three-dimensional representations of terrain and buildings are finding their way into maps. OpenLayers v3 even includes built-in support for Cesium.
- Browser-Based GIS and Spatial Analysis: This is already achievable using libraries like Turf. Turf, a JavaScript library, brings spatial and statistical operations, data classification, and GeoJSON data creation directly to the web browser.
In Conclusion
Each of the online mapping tools highlighted in this guide possesses its own strengths and weaknesses. The code examples showcase the simplicity of using Leaflet compared to the more intricate nature of OpenLayers. However, OpenLayers shines in scenarios where Leaflet’s spatial analysis capabilities might fall short. The ultimate choice boils down to your specific needs.
To recap:
- Google Maps: A well-rounded and established mapping solution, particularly suitable for non-developers who want to embed basic maps into their websites. It’s backed by the power (and potential drawbacks) of Google.
- OpenLayers: Your go-to framework for complex spatial analysis tasks that other frameworks struggle to handle.
- Leaflet: Currently the leading mapping framework for general-purpose mapping, especially when you don’t require the additional services provided by MapBox or CartoDB.
- MapBox: A rapidly growing and disruptive mapping solution, ideal when you need granular control over map styling or require services like high-resolution satellite imagery, geocoding, or directions that other providers lack.
- CartoDB: If you’re dealing with massive datasets in various formats, look no further. CartoDB excels at handling and visualizing large geospatial datasets.