New phone-centric updates just keep rolling out. Yesterday, Google released a pair of new tools created to allow businesses to see how their mobile site speed stacks up against competitors and assess potential revenue loss due to subpar mobile performance.
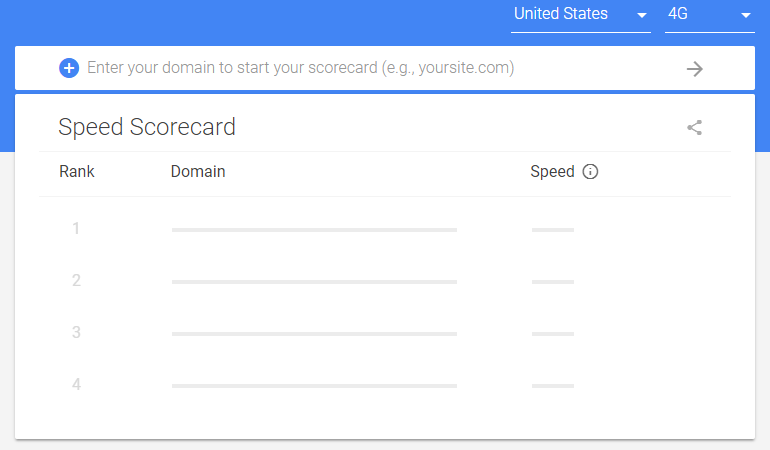
The aptly named Speed Scorecard (shown above) pulls data from Chrome User Experience Reports to provide information about, you guessed it, speed. By entering your domain and that of almost any competitor, you can instantly view a speed score (we’ll delve into what constitutes “speed” shortly). The Impact Calculator utilizes this speed score and other inputs—average monthly visitors, average order value, and conversion rate—and combines them with an interactive sliding scale to project the possible revenue impact of enhanced mobile site speed. Today, we’re diving deep into these free tools and exploring how they can reduce costs and boost performance in your AdWords account. But first…
More Mobile Focus?!
You bet. Last December, Google began transitioning towards a mobile-first indexing to establish the mobile version of websites as the primary reference point, at least from the search engine’s perspective.

Since January 1st, we’ve witnessed Google introduce a wave of mobile-focused features and tools designed to streamline and enhance the user experience on mobile devices. From Chrome’s built-in ad blocker to AMP-based creative platforms and beyond, it’s evident: Google recognizes users’ constant demand for faster, better browsing and is simplifying the process for businesses to pinpoint areas for improvement in their mobile site performance and content.
Utilizing Google’s Mobile Speed Scorecard
Google, the ultimate internet aggregator, knows you, me, the neighbor down the hall, and those kids bouncing a tennis ball off your car all share one thing in common: we’re impatient when it comes to website load times, particularly on our phones. While it might seem like a rebranded version of the mobile PageSpeed tool released alongside Google’s Speed Update in early February, the Speed Scorecard is a whole other animal. Its key distinction lies in the ability to benchmark your site against the competition. Before the Speed Scoreboard, you’re prompted to choose your country and preferred speed metric (3G or 4G):

Google suggests that, on average mobile devices, your website should load within five seconds on 3G and three seconds on 4G. If you’re, say, Sports Illustrated (a sluggish 8 seconds on 4G), you’ve got work to do. Currently, you can select from 12 countries:
- Australia
- Canada
- France
- Germany
- India
- Italy
- Japan
- Netherlands
- Spain
- Sweden
- United Kingdom
- United States After selecting your country and network speed, input your domain and up to nine competitors (meaning you can obtain speed scores for 10 domains simultaneously):
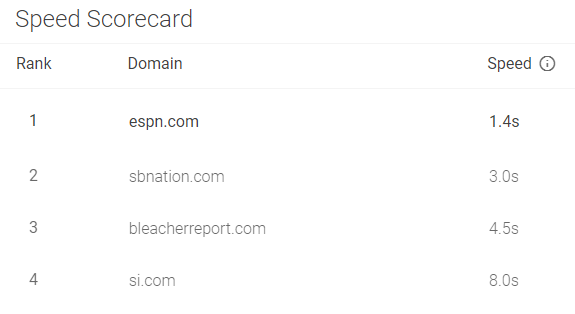
It’s important to note that the “speed” column isn’t based on someone manually timing your site. Instead, it’s an aggregated score comprising three metrics that are, admittedly, beyond my expertise. Here’s Google’s explanation… “No single metric perfectly encapsulates mobile site speed and user experience. As such, the ranking methodology is based on a combination of three metrics as reported across mobile devices by the CrUX Report: First Contentful Paint, DomContentLoaded and Onload. The site speed metric shows the 90th percentile of First Contentful Paint from the CrUX report. However, since rank is based on multiple metrics rather than on First Contentful Paint alone, sites with slower First Contentful Paint times may rank higher than sites with faster First Contentful Paint times.” Clear as mud, right? In essence, your site speed is determined by First Contentful Paint, DomContentLoaded, and Onload. If a domain you want to research isn’t showing up, it’s because the Speed Scorecard’s dataset is based on “a subset of sites from the CrUX Report.” If Google doesn’t recognize you or your rivals, the tool won’t be very useful.
Understanding the Impact Calculator
“Even a one-second improvement could boost conversions.” Sounds too good to be true? Like some marketing myth peddled to wide-eyed interns a few hundred beers deep into a [field]. But watch it in action degree… While a poor mobile experience frustrates website visitors, it can also drain your profits. Google’s Impact Calculator utilizes benchmark data to determine if your site speed is a minor annoyance or a major liability. After your mobile site speed is calculated, the Impact Calculator will automatically populate the figure, along with your domain:
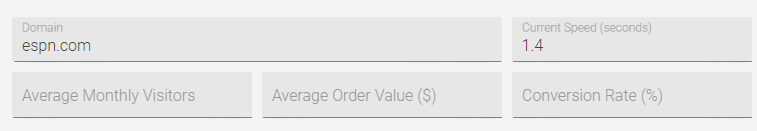
The other three fields necessary for the tool—average monthly visitors, average order value, and conversion rate—aren’t as easily obtained. You could estimate these figures or plug in random numbers to watch the dollar amount skyrocket, but it’s best to use, you know, real data. Average monthly visitors can be effortlessly accessed in Google Analytics or AdWords. To focus solely on paid traffic, use clicks to your site from mobile devices—just ensure you’re segmenting data to isolate mobile traffic.
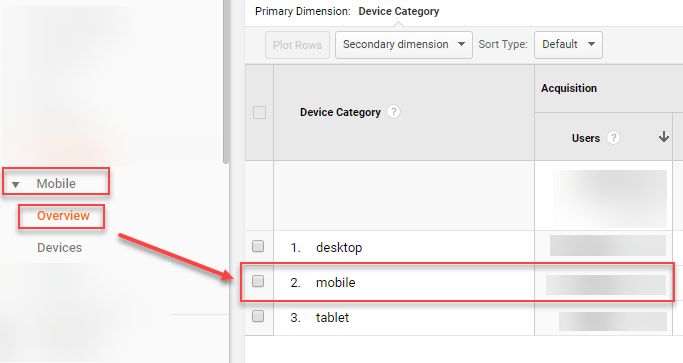
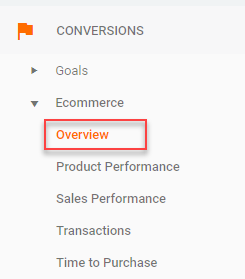
Average Order Value is a bit more involved. If you operate an ecommerce site, go to Google Analytics. Under “Conversion,” select “Overview.”
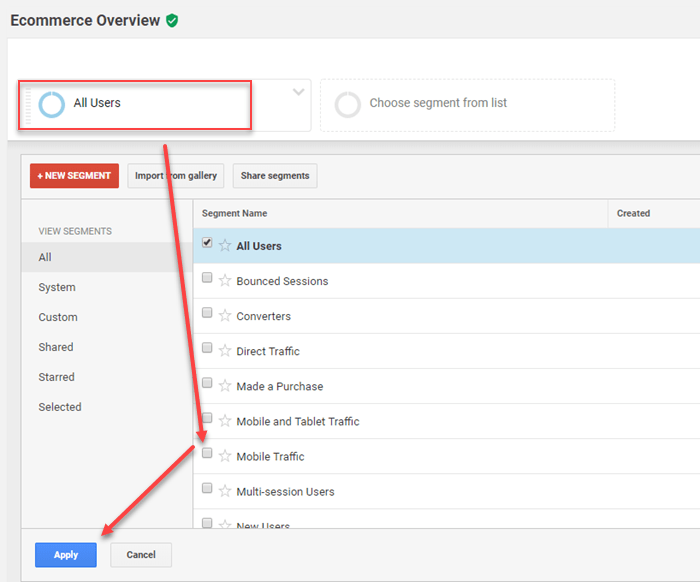
Next, click “All Users” at the top and select the “Mobile Traffic” checkbox instead.
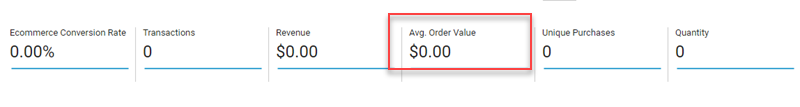
The Average Order Value metric below will adjust to reflect only mobile traffic.
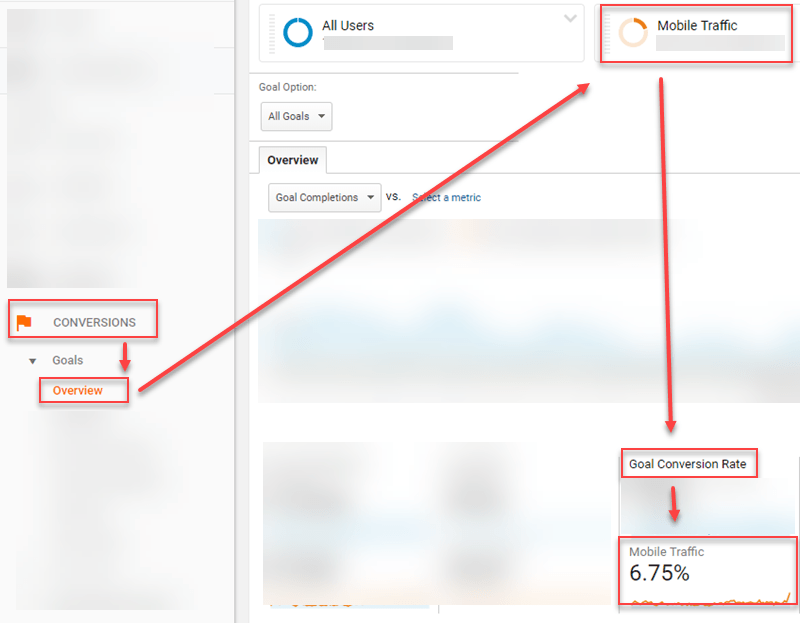
For lead generation, you’ll need a more creative approach. Determine the average sale value and your average conversion rate on mobile devices. Multiply these figures to estimate the value of a lead generated from mobile site traffic. Lastly, if you don’t know your site’s conversion rate on mobile devices, navigate to GA’s Conversions > Goals > Overview and segment mobile traffic as you did for Average monthly visitors.
Once you have this data, enter it into the Impact Calculator to see how much more revenue you could generate by optimizing mobile site speed.
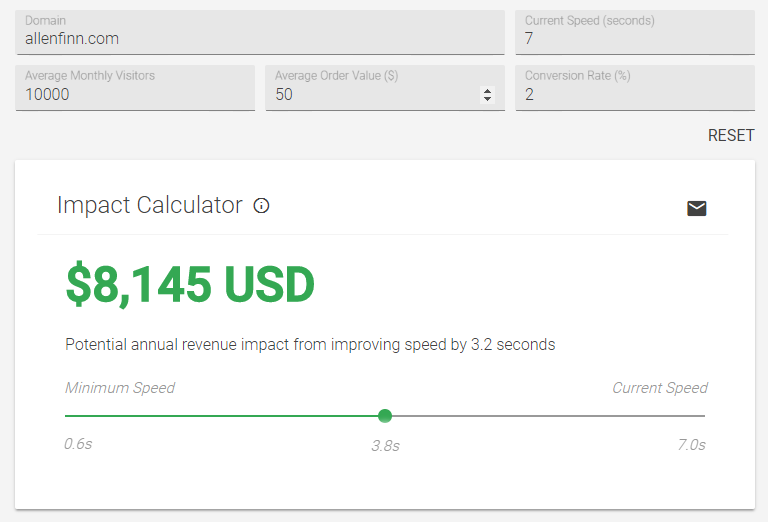
Wow, the owner of allenfinn.com is really missing out…
Is Your AdWords Account Mobile-Friendly?
While the Speed Scorecard and Impact Calculator provide insights for enhancing the experience of all mobile users, neglecting the traffic you’re paying for is simply foolish. Fortunately, Google makes it easy to assess the mobile-friendliness of your landing pages.
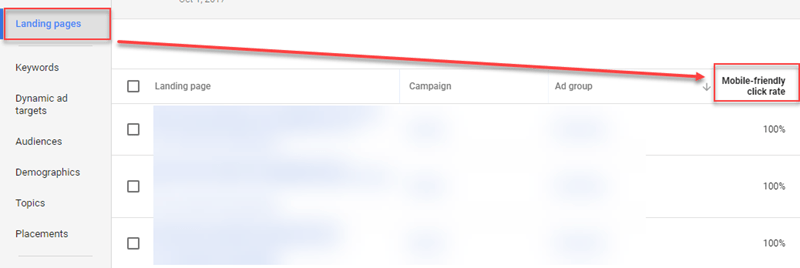
According to Google, “Mobile-friendly click rate is the percentage of mobile clicks on the Search Network that lead to a mobile-friendly page.” Remember, if you’ve implemented changes to your mobile landing pages based on insights from the Speed Scorecard and Impact Calculator, it may take up to two weeks for Google to update this data in AdWords. Why does this matter? A better landing page experience translates to a better Quality Score, resulting in lower CPCs, increased clicks, more conversions, and ultimately, greater earning potential. This puts you on the fast track to sailing off into the sunset on a yacht before you hit 45.
The Bottom Line
Don’t deter potential customers with a slow website. Stop leaving money on the table. Prioritize mobile speed.