It’s crucial to have engaging and well-explained documentation for any project, regardless of its size. This documentation should include illustrations to ensure it is read and utilized effectively.
Since engineers typically develop software solutions for business problems without extensive experience in that specific business, it’s essential to document the business aspect as thoroughly as the software itself.
While documentation can be added later, creating a functional specification before writing any code can be immensely beneficial. This specification serves as a single source of truth for all team members, regardless of their discipline. It also encourages high-level design before implementation, which helps to minimize wasted effort.
This post will guide you through an example project, starting from prototyping to creating a functional specification using an example Ruby on Rails project. This will help illustrate what the application should do and serve as a reference during development. The objective here is to demonstrate how Ruby projects can leverage AsciiDoc and R to:
- Effortlessly prototype new calculations, algorithms, and more using R.
- Seamlessly integrate results generated by R into functional specifications and other written documentation created with AsciiDoc.
- Incorporate these processes into the build process to ensure that the documentation remains current with the latest data and algorithms.
It’s important to note that a functional specification is not meant to replace API documentation generated with tools like RDoc or YARD. Instead, it complements them by serving as a valuable reference point for all stakeholders involved in a project, both technical and non-technical.
Prototype
Let’s imagine a scenario where we want to build an application for salmon fishing enthusiasts to track and share details about their catches. This application needs to include a scoreboard to add a competitive element. While forums currently serve this purpose, structured data with a scoreboard would be significantly more engaging.
Although we could create a prototype in Ruby, it’s not the most suitable language for graphing. Therefore, we’ll utilize R, which offers excellent support for mathematical operations and visualization and is platform-independent.
| |
With just two lines of code, we can import sample data and calculate a score using a proprietary algorithm. R can perform these operations and generate a plot with a basic installation, while languages like Ruby or Python would necessitate additional code and packages.
Documenting the Algorithm
With the scoring system in place, we could proceed directly to coding. In fact, we could have bypassed prototyping in R altogether and prototyped within the Ruby on Rails application itself. However, prototyping in R was efficient and closely mirrored the underlying mathematical concepts. Here’s how we’ll structure the documentation:
kingfisher/Rakefiledoc/func_spec.Radoc
Our example Rails project is named “kingfisher”, and we’ll store the documentation within a dedicated “doc” folder.
We won’t delve into AsciiDoc syntax here, as the Asciidoctor website offers comprehensive documentation. However, here’s how to incorporate a chart into the AsciiDoc using knitr:
| |
By embedding this code snippet into func_spec.Radoc, running knitr and AsciiDoc, you’ll generate documentation that resembles the following:
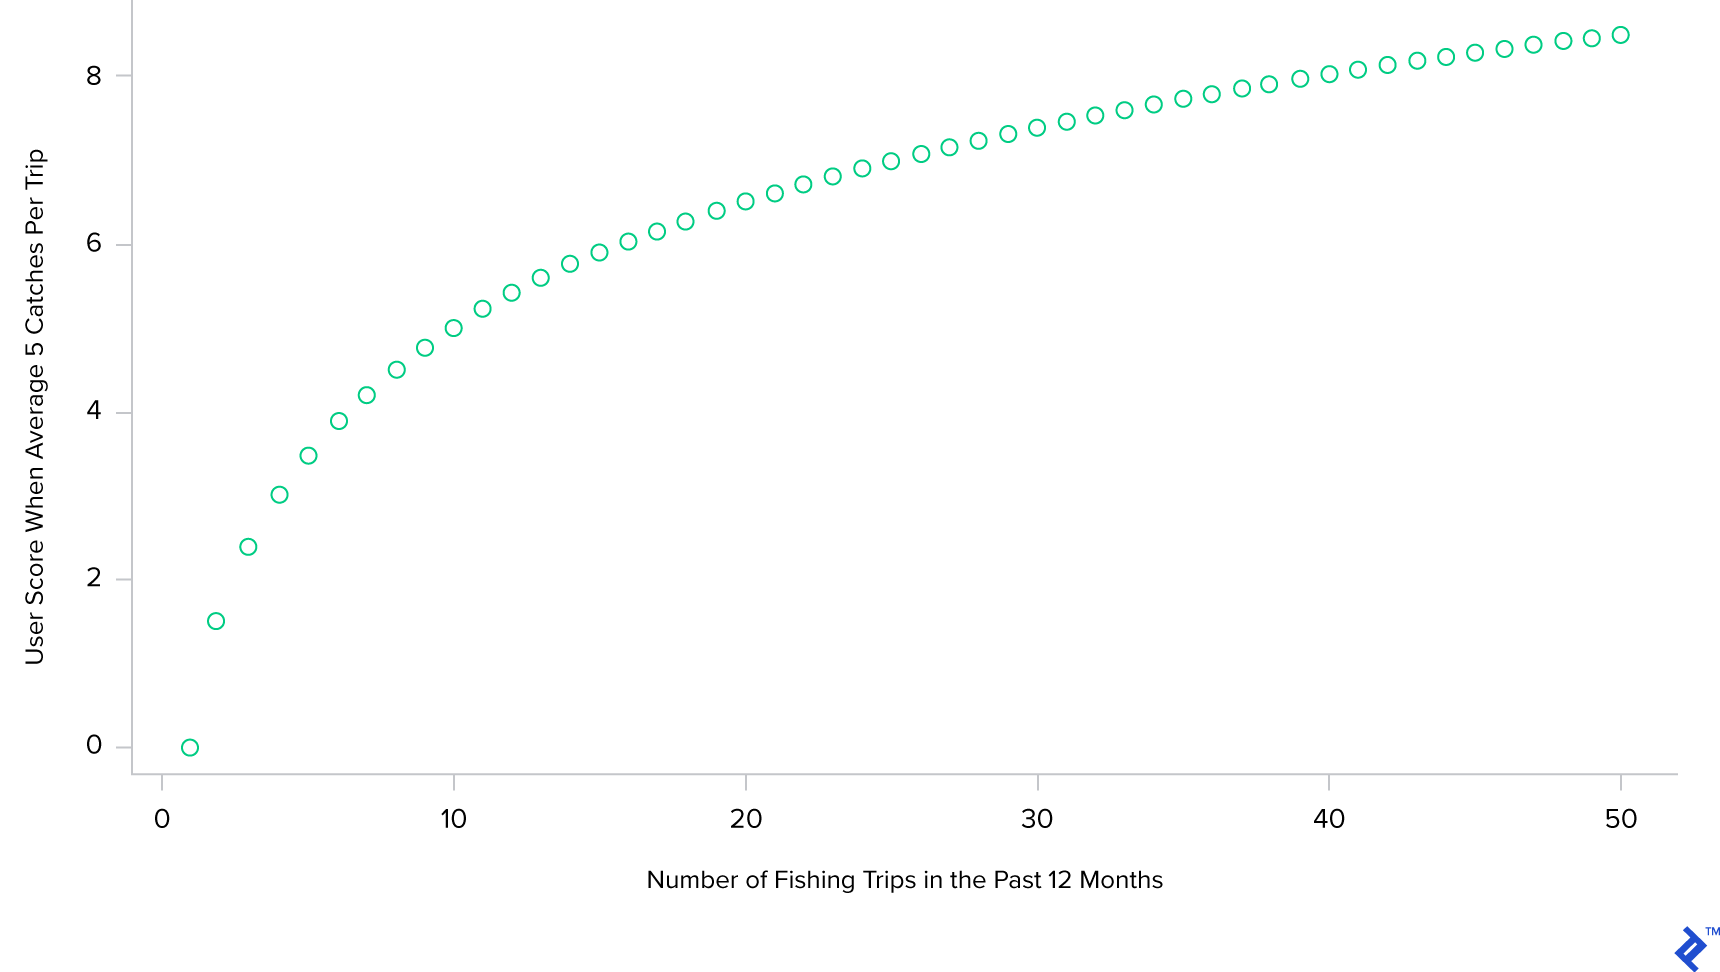
While most developers would likely grasp that the score would increase logarithmically with the fishing frequency, this visual representation provides clear confirmation. We would surround this chart with explanatory text to help developers unfamiliar with fishing understand the rationale behind this choice.
Although this is a simplified example, this prototyping and documentation approach has proven valuable in other projects involving finance and construction estimating, where the results of calculations might not always be immediately evident.
With the score prototyped and a chart ready for inclusion in the documentation, the remaining task is to convert the input AsciiDoc into a suitable output format. For instance, we can utilize the following rules within the Rakefile to transform it into HTML:
| |
By executing “rake docs”, we can generate and update the documentation, ensuring it stays aligned with any modifications to the underlying data or scoring calculations.
Other Solutions
AsciiDoc is an excellent choice for documenting Ruby on Rails projects, regardless of whether the documentation includes custom graphics. It provides a Ruby-native approach to writing in a clean and readable markup format.
However, other excellent documentation tools might require a bit more effort to manage and integrate into the build process of a Rails project.
For example, Sphinx processes reStructuredText (another excellent markup format) and can incorporate output from Matplotlib. This combination works perfectly for Python projects, offering a Python-native solution for generating high-quality documentation with custom graphics. However, it’s less ideal for Rails projects, as it introduces the overhead of managing multiple sets of dependencies and a separate environment solely for documentation generation.
Numerous other documentation solutions exist, including programs like doxygen and LaTeX, each with its own integration requirements. If a specific system like LaTeX is necessary, then, by all means, use it. However, for relatively standard Rails projects that involve a manageable amount of math requiring documentation, the combination of AsciiDoc and R provides an effective and streamlined solution.
Conclusion
Ruby and AsciiDoc work together seamlessly, and integrating R into the mix makes it effortless to incorporate visually appealing visualizations into your documentation. You can leverage any package from the extensive R ecosystem, such as ggplot2, to produce stunning charts for your documentation.
The source code for this post is available in its entirety on GitHub at repo. Please note that as of this writing, the repository does not contain a fully-fledged “real” project, but this may change in the future!
If you’d like to further enhance your Ruby expertise, I highly recommend exploring the world of metaprogramming with Ruby Metaprogramming Is Even Cooler Than It Sounds.