In my last blog post, we talked about how most apps aren’t very profitable. I said that one of the most important things for making money with your app is tracking the right data.
I used the example of a mobile game, but you can use those same ideas for almost any kind of app. However, you might need to use different data depending on the type of app. In this post, we’ll look at a fitness app that makes money through subscriptions.
The Classic Sales Funnel
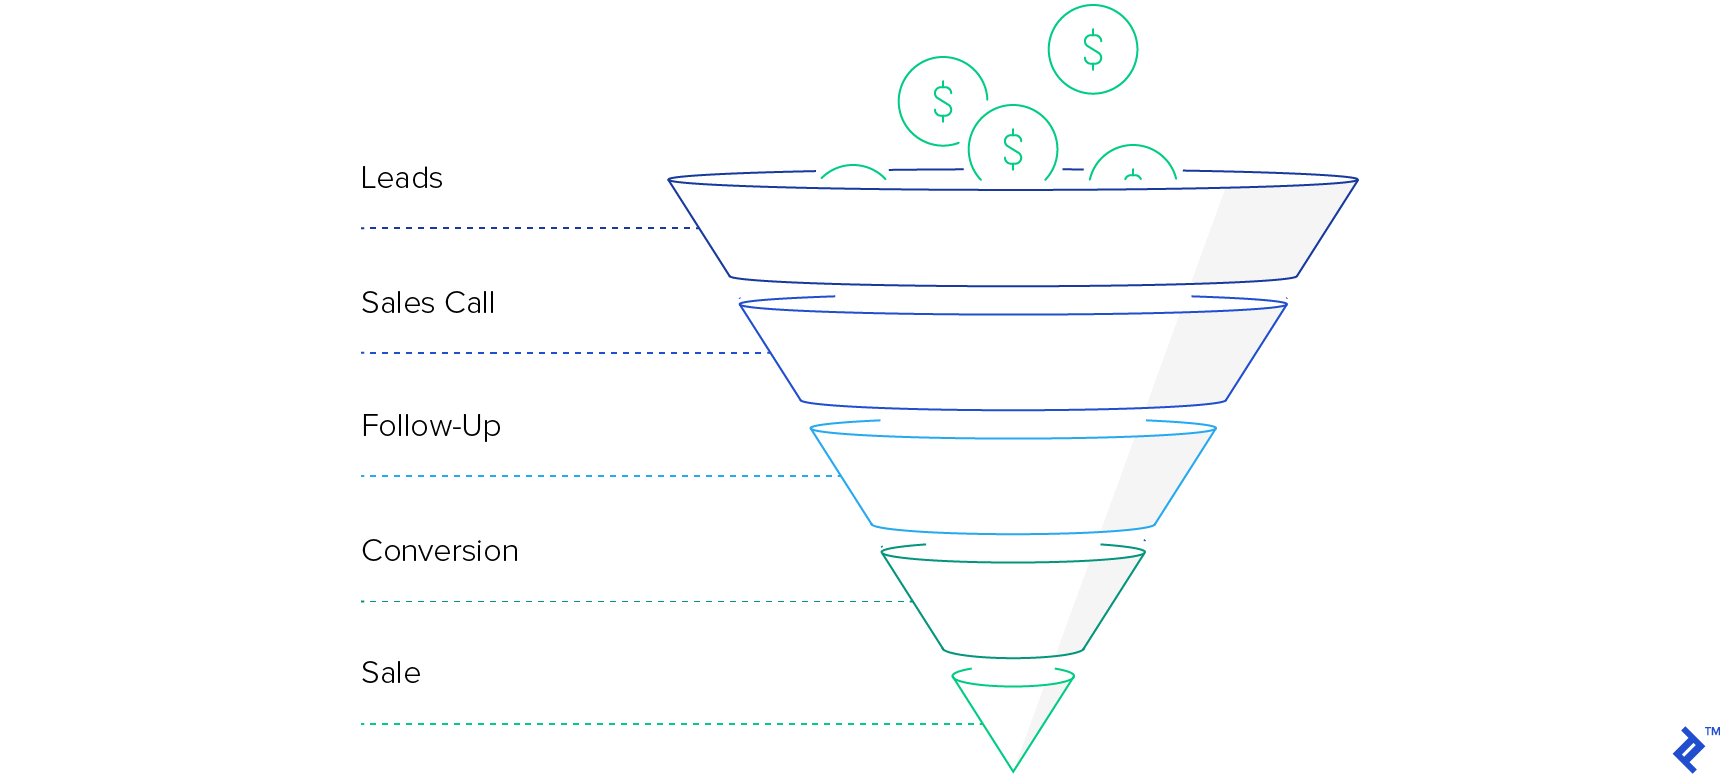
Ever since people started selling things, there’s been something called a sales funnel. It’s a way to see how customers go from first hearing about your business to actually buying something.
A good sales funnel strategy helps you understand where each potential customer is in their journey, gives you ideas for moving them to the next stage, and shows you where you’re losing the most potential customers.
Using the Funnel for Mobile Apps
Instead of focusing on leads, sales calls, and follow-ups, we’ll use data that shows how far a user goes within our app. Think of it like this: Download → Create Account → First Try → Sign Up. (Our example will be a bit more detailed, but the idea is the same for almost any app.)
It’s worth noting that you can (and probably should) expand this funnel at the top to include how you’re getting those downloads. For something like a Facebook ad, this could be impressions and clicks. For App Store optimization, this could be impressions and App Store page views. But for this article, we’ll focus on the app itself, not the marketing.
Choosing the Right Funnel Steps
I’m going to use my own app, Charge Running, as an example. We offer live running classes on your phone for $9.99 a month. Each class happens at a specific time, and there’s a real person coaching you through every run.
You can think of almost any user onboarding process as a funnel. Companies like eBay have a fairly standard approach that’s used by many apps. Facebook, on the other hand, is a great example of an app that focuses on how many times a user does a specific action. For Charge Running, we went with something closer to Facebook’s model:
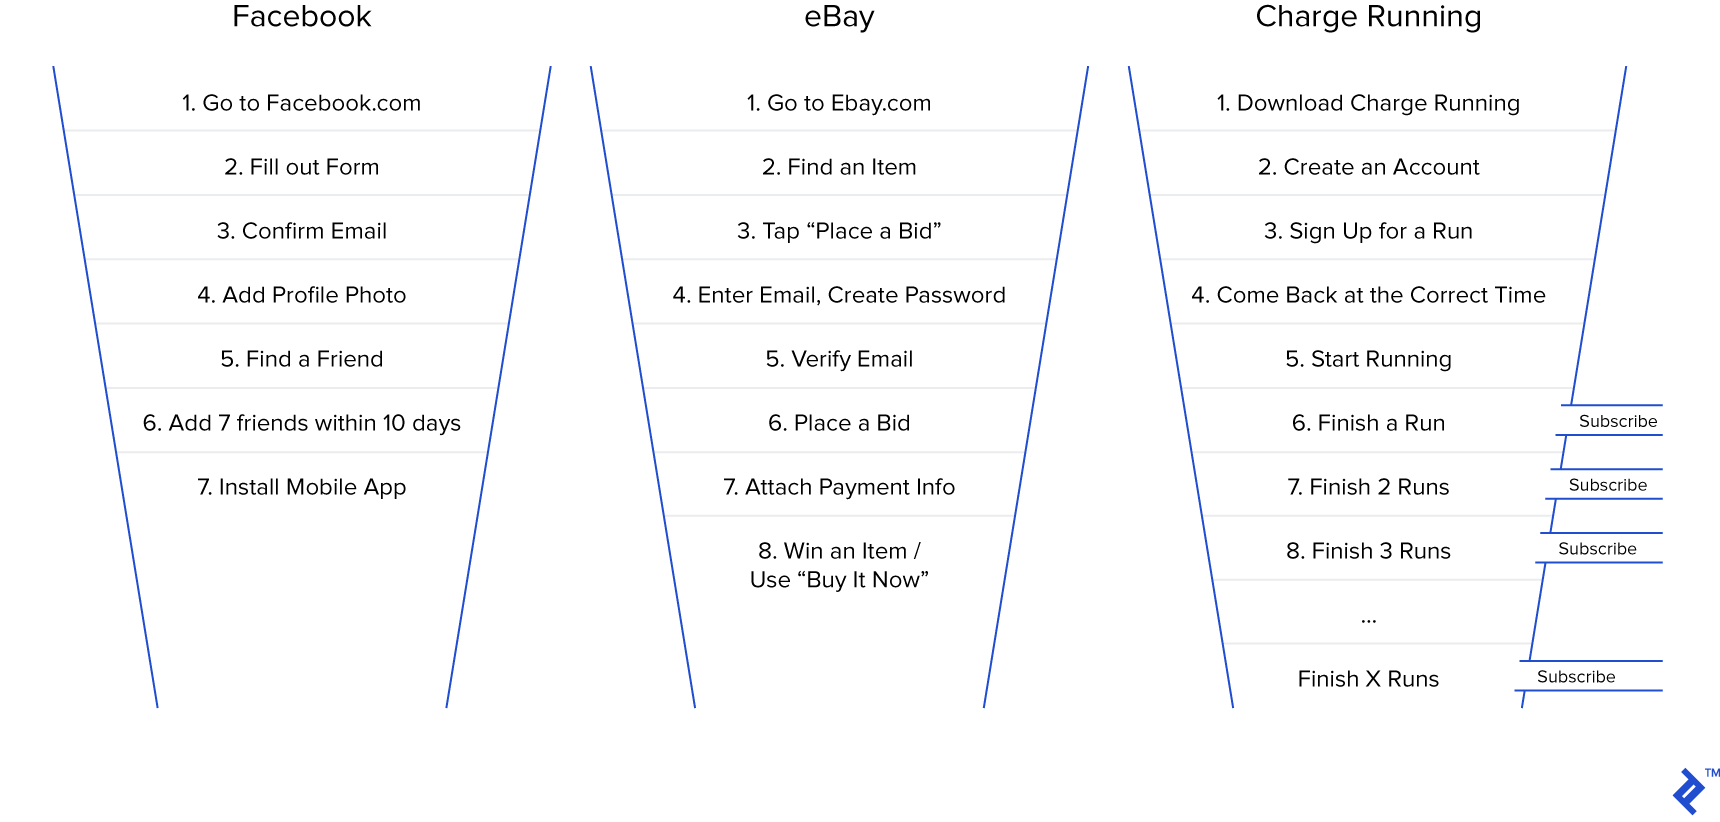
Early on, Facebook realized that if they could get a user to connect with seven friends in 10 days on the platform, that user would stick around. So, they focused most of their efforts on getting people to those first seven friends.
We predicted (correctly!) that if someone did 3-4 runs with us, they’d likely subscribe. With that in mind, here are the steps in our app’s funnel:
Download → Create Account
Out of 100 downloads, how many people create an account?
Create Account → Sign Up for a Run
Out of those with an account, how many actually commit to running with us at a specific time?
Sign Up for a Run → Open the App at the Right Time
Do people actually open the app when they’re supposed to run?
Open the App → Start Running
If they’re in the app at the right time, do they actually start running, or are they just listening?
Start Running → Finish a Run
Do they enjoy the run enough to finish the whole workout?
Complete 1 Run → 2 Runs → 3 Runs → 4 Runs
Once they’ve finished a run, how many come back for more?
Complete X Runs → Subscribe to Charge
If they’re doing multiple runs, what percentage subscribe?
Getting the Data
I haven’t found a perfect tool for tracking all of this, so the best method I’ve found is to gather the data and build something to track it manually.
Our app database already needed all of this information to function, so we made a copy of it and wrote code to track each user’s progress through the funnel. This took more work, but it gave us more control.
To visualize this data, we used a free, open-source tool called Metabase. With Metabase, you can visualize your data and create stats and funnels from your existing database. If you’re using a SQL database for your app, this tool might be all you need.
Metabase lets you look up information about your app without writing code, but you can also customize things further with SQL queries. You can also create dashboards that you can check daily, and you can create different dashboards for different roles within your company. For example, our coaches’ dashboard looks very different from our funnel dashboard. This way, everyone has easy access to the stats that matter most to them.
When looking at these metrics, make sure to look at each step in two ways:
- From the previous step to the current step (e.g., Step 3 → Step 4)
- From the first step to the current step (e.g., Step 1 → Step 4)
The first way helps you monitor and tweak things more easily to see improvements. The second way shows you where you’re losing the most users, so you can prioritize which step to focus on next.
Making Your App’s Numbers Better
Once you create a funnel like this, you’ll almost always find that you’re losing customers in unexpected places. (This is very specific to each app, but there are general guidelines that can help you improve any part of your funnel. We’ll cover those in Part 3 of this series, “How to Improve your Metrics.”)
Here’s a quick example: In our app’s first version, we had tons of people signing up for classes, but very few were showing up on time. Why were so many people committing to run with us but then not showing up when it was time?
The first step was figuring out the problem. We talked to as many people as possible and discovered a few key issues. The biggest one was a lack of user education. People didn’t fully understand what the product was or what the countdown timer meant. We updated the waiting screen to include more information about what would happen next and what they needed to do.
We also realized that people needed constant reminders to join their runs on time. So, we added push notifications to remind them that their run was starting soon. We also made it possible to add the run to their calendar and invite a friend to join, so they’d have someone to hold them accountable. These were all relatively small changes, but some of them made a big difference.
As of today, we’ve released over 30 updates to the App Store, each one focused on improving a specific part of the funnel, and we’ve closely tracked the results. No one gets their app perfect on the first try, so be prepared to test, analyze, and iterate.
With each new version, we could compare our current funnel to the new one. If you have enough users and development time, you can also test multiple things at once using A/B testing. This involves creating two versions of your funnel and randomly assigning users to one or the other. The goal of all this testing is to give you a set of levers to pull and see how they affect your app’s overall profitability.
Figuring Out the Lifetime Value (LTV)
In the previous article, we talked about LTV, a crucial metric for app success. However, we need a slightly different approach to calculate it here.
The percentage of people who go from the first step of the funnel to the last step is your conversion rate. You calculate it like this:
Number of subscribers or purchasers / Number of users at the top of the funnel
For example, 4 subscribers / 100 downloads = 4 percent.
If you’re aiming for a single purchase (like unlocking the pro version or buying an item), the formula is simple: First, calculate the net profit per user (purchase price minus costs like Apple’s or Google’s 30% cut, server hosting, etc.). Then, multiply that by your conversion rate. For example, if I have a $29.99 purchase with a 4% conversion rate, the calculation would be:
$29.99 * 70% = $20.99 (Apple’s or Google’s cut removed, i.e., net profit per user) $20.99 * 4% = $0.83 (LTV)
For subscription-based apps, we need to know how long a subscriber typically stays with us to calculate the LTV.
Subscriber Retention
Getting a user to subscribe is great! But then you have to think about retention and churn.
Retention is the percentage of users who stay for a specific period. Churn is the opposite: how many users you lose each month.
There are tons of things you can do to influence churn. For now, we’ll focus on measuring it and using it to figure out how long the average user stays subscribed.
If you’ve been around for a while, you might already have this number or the data to calculate it. For a rough estimate, you can use your churn rate for the first month (usually the highest) and assume it stays consistent. Just take the inverse of that number to find the average subscriber lifespan. For example, if you lose 20% of your subscribers each month, the average subscriber lifespan would be 1 / 0.20 = 5 months.
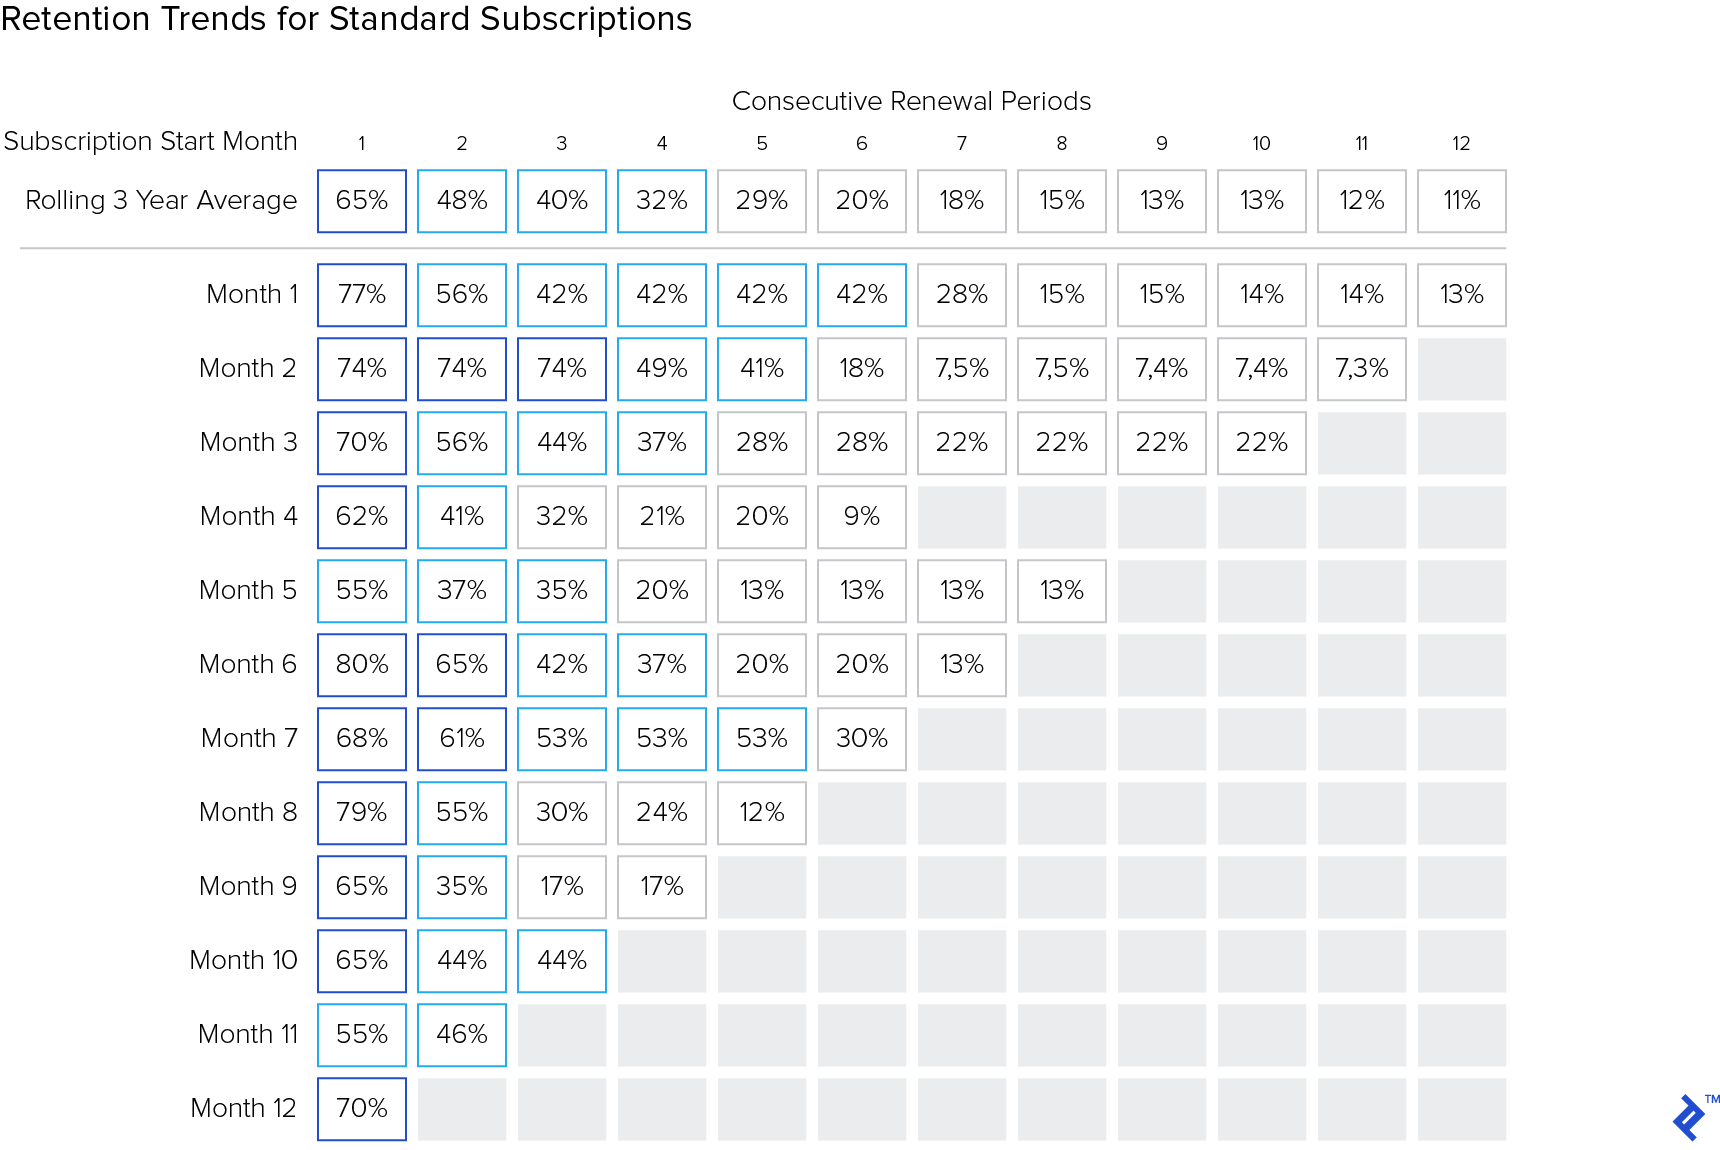
Keep in mind that churn can vary significantly from month to month. For example, your churn rate for month-1 renewals will likely be higher than for month-6 renewals. If you know your churn rate for the next 12 months, you can use those numbers to calculate an average churn rate. This applies to weekly and yearly subscriptions as well.
There are many ways to calculate the average subscription length. Depending on your app, you might calculate it based on how long they’ve been subscribed, where they are in completing something (like a course in an educational app), or even the season of the year for a fitness app. Do some research and find a system that works for you. Once you know the average subscription length, you can move on to the next step.
Back to LTV with Retention
Once we know the average subscription length, calculating the LTV is simple:
Subscription cost × Number of billing cycles subscribed
For example, if we make $20.99 per user per month and the average subscriber stays for 10 months, our LTV is $209.90.
If you have multiple subscription options (like monthly and annual plans), you can do the same calculation for each option and then multiply it by the percentage of users who choose that option to get an overall LTV.
For example, if 66% of your users choose the monthly plan and 34% choose the annual plan, the calculation would be:
Monthly LTV × 66% + Yearly LTV × 34% = Average LTV
This might reveal that one subscription option is significantly more profitable than the others. If that’s the case, you might want to adjust the pricing to make the other options more appealing or even eliminate them altogether. Knowing your LTV is one of the most valuable insights you can have. It helps you determine how much you’re willing to spend to acquire a user and make better decisions about your marketing strategy.
Funnel vs. ARPDAU: When to Use Each
So, when should you use this funnel model instead of the average revenue per daily active user (ARPDAU) model from the first blog post? While you can definitely use both, I’d recommend starting with the one that fits your business best. You can always expand later!
ARPDAU is a good starting point if:
- Your app’s main source of revenue is micro-transactions or ads.
- There’s a direct link between how much time a user spends in your app and how much money they spend (like a shopping app).
- Your primary income comes from gathering data about users (like a social network).
A funnel approach is probably better if:
- You want users to make a single purchase (like unlocking the full version of your app).
- You use subscriptions, and your revenue doesn’t depend on whether a user opens the app every day.
- Users need to complete multiple steps after launching your app to make a purchase, and you’re not sure where you’re losing them.
What’s Next?
Now that you understand how mobile funnels work, it’s time to improve your numbers! Brainstorm ideas with your team, build and test things quickly, and get rid of features that don’t help your conversion rate.