When discussing the architecture of microservices and containerization, one specific group of production-tested tools has dominated the conversation in recent years: the service mesh.
It’s true that microservices architecture and Kubernetes (often shortened to “K8s”) have rapidly become the standard for applications designed to scale, pushing the issue of managing inter-service communication to the forefront—and making service meshes a very appealing solution. My own experience includes using service meshes in production environments, particularly Linkerd, Istio, and a previous iteration of Ambassador. However, what exactly do service meshes do? Which one is the most suitable? How do you determine if you even need one?
To address these questions, it’s helpful to grasp why service meshes were initially created. Historically, in conventional IT infrastructure, applications operated as monolithic entities. A single service ran on a single server; if more capacity was required, the answer was to scale it vertically by allocating a larger machine.
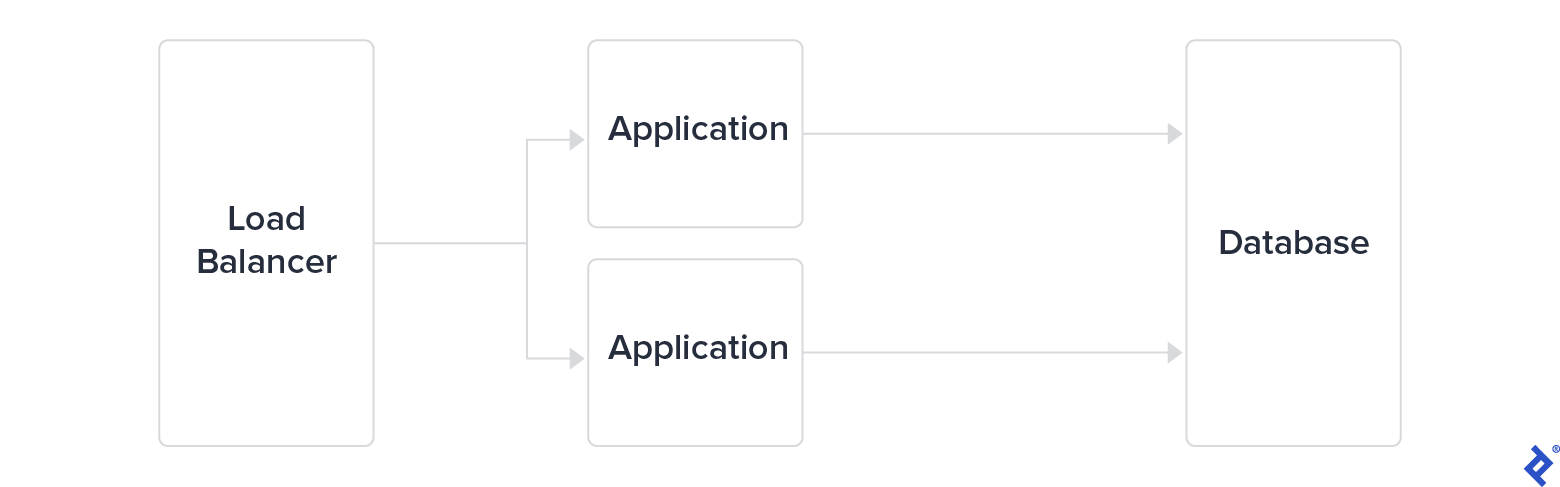
As this approach reached its limits, major tech companies swiftly adopted a three-tier architecture. This involved separating the load balancer from both the application servers and the database tier. While this provided a degree of scalability, they opted to further divide the application tier into microservices. The communication among these services became crucial to monitor and secure for applications to scale effectively.
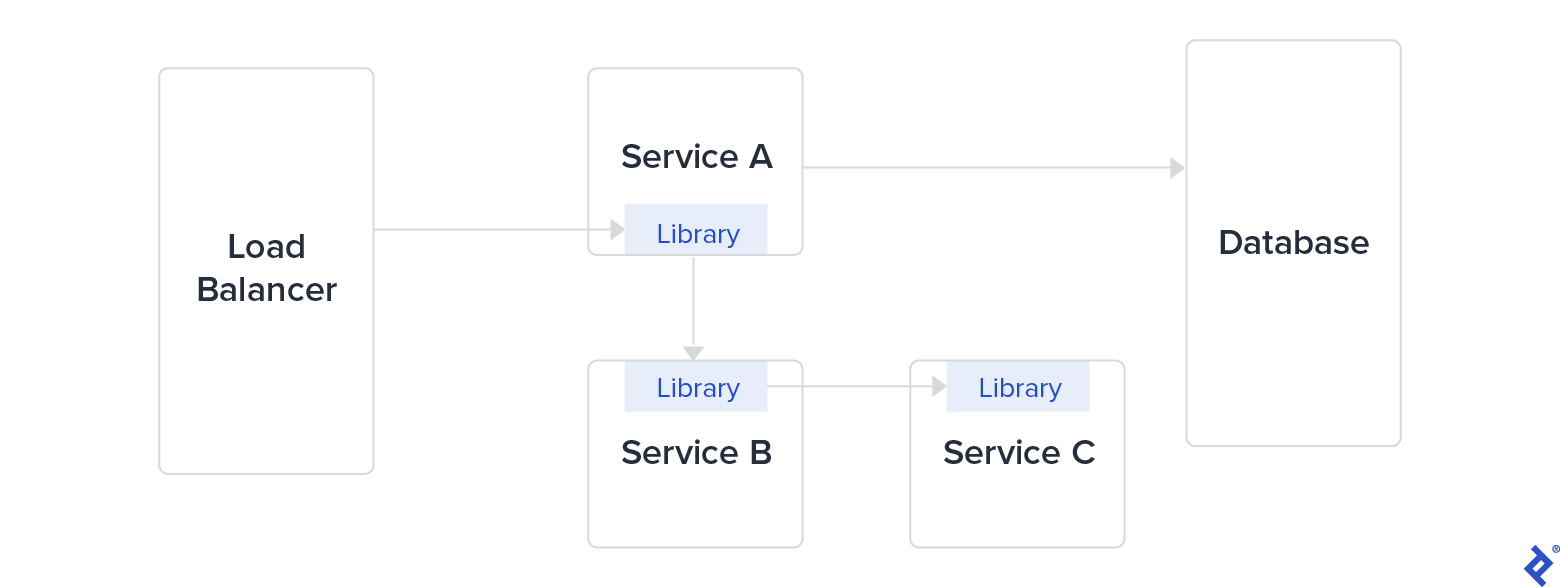
To facilitate communication between services, these companies developed internal libraries: Finagle at Twitter, Hystrix at Netflix, and Stubby at Google (which became gRPC in 2016). These libraries were designed to tackle challenges posed by microservices architecture, such as security between services, latency, monitoring, and load balancing. Managing a large library as a dependency, especially across multiple programming languages, is both complex and time-intensive.
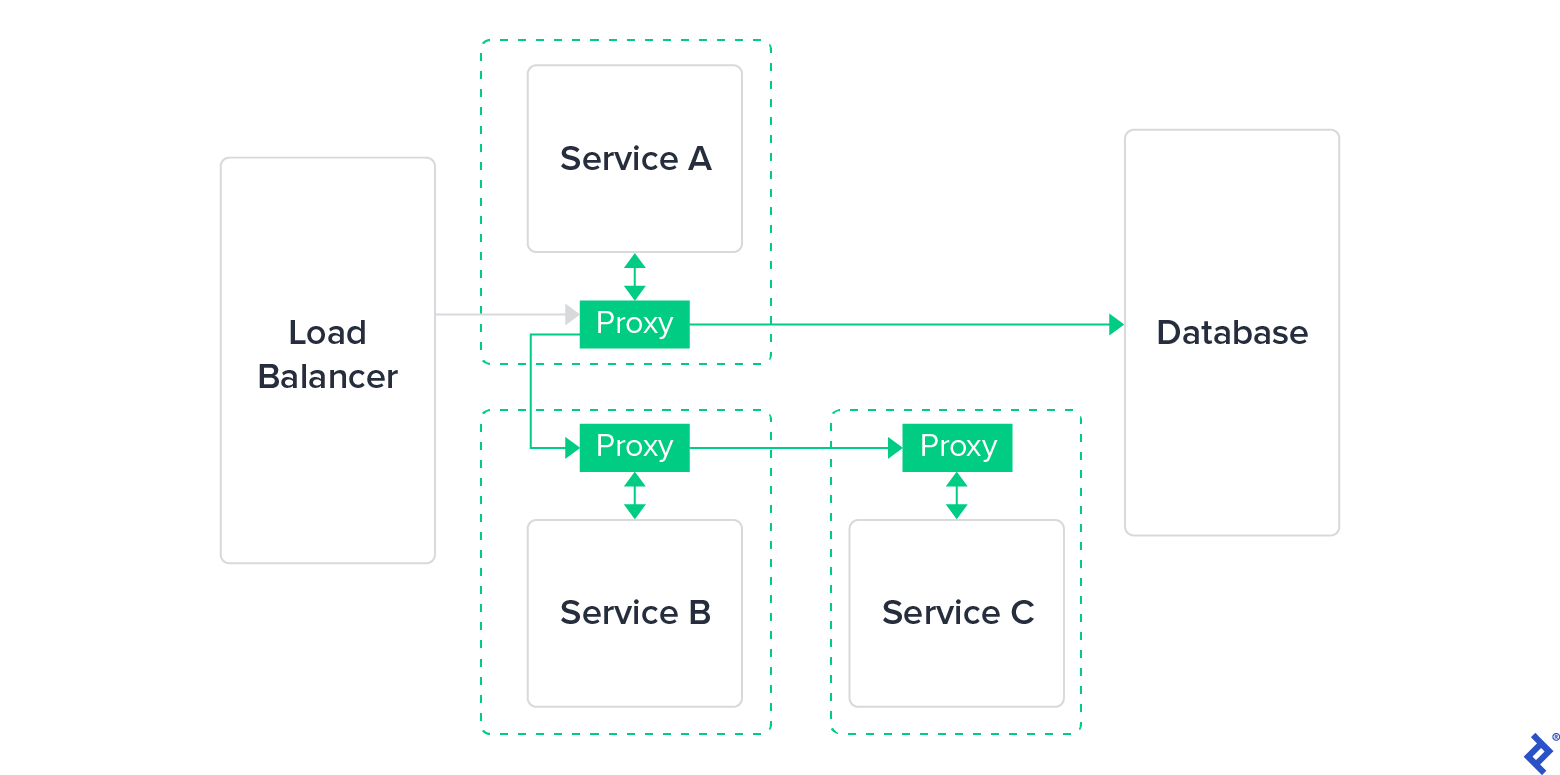
Eventually, this kind of library was replaced with a more user-friendly and lightweight proxy. Such proxies functioned externally, independent of the application layer—potentially even transparent to it—and were simpler to update, maintain, and deploy. This marked the birth of the service mesh.
What Exactly Is a Service Mesh?
A service mesh is a software infrastructure layer designed to manage the flow of communication between services; it typically comprises two key components:
- The data plane is responsible for managing communication close to the application. It’s often deployed alongside the application as a collection of network proxies, as illustrated earlier.
- The control plane acts as the “brain” of the service mesh. It communicates with proxies to distribute configurations, ensure service discovery, and centralize observability.
Service meshes primarily aim to achieve three main objectives related to communication between services:
- Connectivity
- Security
- Observability
Connectivity
This facet of service mesh architecture enables service discovery and dynamic routing. It also encompasses communication resilience, including aspects such as retries, timeouts, circuit breaking, and rate limiting.
A fundamental feature of service meshes is load balancing. Having all services interconnected by proxies allows for the implementation of load-balancing strategies between services. These include methods like round robin, random selection, and routing to the server with the fewest requests. These policies determine how the service mesh chooses which replica will receive the original request, similar to having miniature load balancers positioned in front of each service.
Lastly, service meshes offer routing control through mechanisms like traffic shifting and mirroring.
Security
In a traditional microservices architecture, services interact with each other using unencrypted traffic. However, unencrypted internal traffic is now considered a security risk, especially in the context of public cloud infrastructure and zero-trust networks.
Apart from safeguarding the confidentiality of client data where direct control over hardware is absent, encrypting internal traffic introduces an extra layer of complexity that is beneficial in the event of a system compromise. Consequently, all service meshes utilize mutual TLS (mTLS) encryption for communication between services, specifically for all inter-proxy communication.
Service meshes can even enforce intricate matrices of authorization policies, granting or denying traffic access based on rules targeting specific environments and services.
Observability
Service meshes aim to enhance the visibility of communication between services. By governing the network, a service mesh enforces observability, providing layer-seven metrics, which in turn enable automated alerts when traffic levels reach certain customizable limits.
This control, typically supported by external tools or plug-ins such as Jaeger or Zipkin, also facilitates tracing through the injection of HTTP tracing headers.
Benefits of Using a Service Mesh
The creation of the service mesh was driven by the need to alleviate some of the operational overhead inherent in microservices architectures. Anyone with experience in microservices architectures can attest to the considerable effort required to operate them effectively on a day-to-day basis. Harnessing the full potential of microservices usually necessitates external tools to manage aspects like centralized logging, configuration management, and scaling mechanisms. Implementing a service mesh standardizes these capabilities, simplifying their setup and integration.
Service mesh observability, in particular, unlocks highly versatile debugging and optimization techniques. By providing detailed and comprehensive visibility into the exchanges happening between services, engineers—especially SREs—gain the ability to troubleshoot potential errors and system misconfigurations more rapidly. Using service mesh tracing, they can follow the journey of a request from its point of entry into the system (at a load balancer or external proxy) all the way to internal services within the stack. They can leverage logging to track a request and record the latency it experiences at each service. The ultimate outcome is in-depth understanding of system performance.
Traffic management provides powerful options before fully deploying new versions of a service:
- Reroute a small fraction of requests.
- Even more effectively, mirror production requests to a new version, enabling testing with real-time traffic.
- Conduct A/B testing on any service or combination of services.
Service meshes streamline all these scenarios, making it easier to prevent and/or mitigate unexpected issues in production.
Comparing Kubernetes Service Meshes
In many respects, service meshes are the definitive toolkit for microservices architecture; many operate on top of one of the leading container orchestration tools, Kubernetes. What’s the best service mesh for Kubernetes? We’ve highlighted three of the most prevalent service meshes currently running on Kubernetes: Linkerd (v2), Istio, and Consul Connect. Currently, Istio appears to be the most widely used service mesh. We’ll also touch upon some other notable service meshes: Kuma, Traefik Mesh, and AWS App Mesh. While they are less prominent in terms of adoption and community size, their potential warrants a closer look and should be monitored.
A Brief Overview of Sidecar Proxies
Not all Kubernetes or K8s service meshes adopt the same architectural approach, but a common strategy is leveraging the sidecar pattern. This involves attaching a proxy (the sidecar) to the primary application, enabling it to intercept and control the application’s incoming and outgoing network traffic. In a Kubernetes environment, this is typically achieved by deploying a secondary container within each application pod. This secondary container mirrors the lifecycle of the main application container.
There are two primary benefits to the sidecar approach for service meshes:
- Sidecar proxies function independently of both the runtime environment and the programming language used by the application.
- This allows for easy implementation of all service mesh features across the entire stack, regardless of where they’re needed.
- A sidecar operates with the same permissions and access to resources as the application itself.
- The sidecar can assist in monitoring resources consumed by the main application, eliminating the need to embed monitoring directly into the main application’s codebase.
However, sidecars come with both advantages and drawbacks due to their direct influence on an application:
- The initialization of a sidecar has the potential to create a deadlock during the application’s startup process.
- Sidecar proxies introduce potential latency overhead to your application.
- Sidecar proxies also consume resources, which can result in significant costs when operating at scale.
Due to these pros and cons, the sidecar approach is a frequent topic of discussion within the service mesh community. It’s worth noting that four out of the six service meshes examined in our comparison employ the Envoy sidecar proxy, while Linkerd relies on its own custom sidecar implementation; Traefik Mesh, on the other hand, does not incorporate sidecars in its design.
Linkerd Review
Making its debut in 2017, Linkerd holds the title of the oldest service mesh available. Developed by Buoyant (a company founded by two former Twitter engineers), Linkerd v1 was built upon Finagle and Netty.
Linkerd v1 was considered ahead of its time, offering a comprehensive and production-ready service mesh solution. However, it also had a considerable resource footprint. Additionally, gaps in its documentation made it challenging to set up and operate in a production setting.
Recognizing this, Buoyant had the opportunity to work with a complete production model, gaining valuable experience and insights. The result of these learnings was Conduit, a complete rewrite of Linkerd released in 2018. Later that year, Conduit was renamed Linkerd v2. This new version brought several compelling improvements; as Buoyant discontinued active development on Linkerd v1, our subsequent references to “Linkerd” throughout this article will pertain to v2.
As a fully open-source project, Linkerd relies on a custom-built proxy written in Rust for its data plane and source code written in Go for its control plane.
Connectivity
Linkerd proxies offer retry and timeout capabilities but, as of now, lack features like circuit breaking or delay injection. It provides extensive ingress support, seamlessly integrating with popular ingress controllers such as:
- Traefik
- Nginx
- GCE
- Ambassador
- Gloo
- Contour
- Kong
Service profiles within Linkerd unlock enhanced routing capabilities, providing users with metrics, retry adjustments, and timeout settings, all configurable on a per-route basis. In the realm of load balancing, Linkerd offers automatic proxy injection, its own dedicated dashboard, and native support for Grafana.
Security
Linkerd’s mTLS support is user-friendly, featuring automated initial setup and daily key rotation.
Observability
By default, Linkerd’s statistics and routes can be monitored via a command-line interface (CLI). For a graphical view, options include preconfigured Grafana dashboards and Linkerd’s native dashboard.
Linkerd allows for seamless integration with a Prometheus instance.
Tracing can be enabled through an add-on that utilizes OpenTelemetry (formerly OpenCensus) as the collector, with Jaeger handling the tracing process itself.
Installation
Installing Linkerd involves injecting a sidecar proxy, achieved by adding an annotation to your resources within Kubernetes. There are two primary approaches to accomplish this:
- Using a Helm chart. (Helm is often the preferred choice for configuring and managing Kubernetes resources through templates.)
- Installing the Linkerd CLI and using it to install Linkerd into a cluster.
The second method starts by downloading and running an installation script:
| |
Once executed, the Linkerd CLI tool, linkerd, provides a comprehensive toolkit to complete the Linkerd installation and interact with both the application cluster and the control plane.
Running the command linkerd check --pre will perform all necessary preliminary checks for your Linkerd installation, generating clear and detailed logs to pinpoint any potential issues that might hinder a successful installation. Without the --pre flag, this command can be utilized for post-installation debugging.
The subsequent step is to install Linkerd within the cluster. This is done by running the command:
| |
Linkerd will then install various components, each with a minimal resource footprint, adhering to a microservices approach:
- linkerd-controller: Provides the public API used by both the CLI and dashboard.
- linkerd-identity: Serves as the certificate authority, enabling mTLS implementation.
- linkerd-proxy-injector: Handles the injection of the proxy by modifying a pod’s configuration.
- linkerd-web: Hosts a dashboard for monitoring deployments, pods, and Linkerd’s internal components.
Linkerd predominantly relies on CustomResourceDefinitions (CRDs) for configuration. This is considered a best practice in Kubernetes add-on development—similar to persistently installing a plug-in within a Kubernetes cluster.
Incorporating distributed tracing—a feature that may or may not be desired by Linkerd users due to some common myths—requires an additional step involving linkerd-collector and linkerd-jaeger. This involves creating a configuration file:
| |
To activate tracing, execute the command:
| |
As with any service mesh built on sidecar proxies, you’ll need to modify your application code in order to enable tracing. In essence, this involves adding a client library to generate tracing headers; this library then needs to be included in each service.
Linkerd’s traffic splitting capability, accessible through its Service Mesh Interface (SMI)-compliant API, already facilitates canary releases. However, automating this and managing traffic effectively requires external tooling like Flagger.
Flagger, a progressive delivery tool, monitors what Linkerd refers to as “golden” metrics: “request volume, success rate, and latency distributions.” (Initially, Google SREs used the term golden signals included a fourth metric—saturation—but Linkerd doesn’t cover it, as it would require metrics not directly accessible, such as CPU and memory usage.) Flagger keeps track of these metrics while distributing traffic using a feedback loop; this enables you to implement automated and metrics-driven canary releases.
After exploring the installation process, it’s evident that getting a Linkerd service mesh up and running with commonly sought-after capabilities can easily involve a dozen or more services. However, Linkerd provides more of these services upon installation compared to other service meshes.
Linkerd Service Mesh Summary
Advantages:
- Linkerd benefits from the expertise of its creators, two former Twitter engineers who had worked on the company’s internal tool, Finagle, and gained further insights from Linkerd v1. As one of the pioneering service meshes, Linkerd boasts a vibrant community (its Slack channel alone has over 5,000 members, supplemented by an active mailing list and Discord server) and extensive documentation and tutorials. Linkerd has reached a mature stage with its 2.9 release, as evidenced by its adoption by prominent companies by big corporations such as Nordstrom, eBay, Strava, Expedia, and Subspace. Paid, enterprise-grade support from Buoyant is available for Linkerd.
Drawbacks:
- There’s a steep learning curve associated with harnessing the full potential of Linkerd service meshes.
- Linkerd is limited to Kubernetes containers (lacking a VM-based, “universal” mode).
- Linkerd’s sidecar proxy is not Envoy. While this grants Buoyant the freedom to customize it extensively, it sacrifices the inherent extensibility offered by Envoy. This also means Linkerd lacks support for features like circuit breaking, delay injection, and rate limiting.
- There’s no dedicated API for easy control and management of the Linkerd control plane. (Although you can find the gRPC API binding.)
Linkerd has made significant strides since v1 in terms of usability and installation simplicity. The lack of an officially exposed API is a notable shortcoming. However, its well-structured documentation makes it straightforward to explore and test Linkerd’s out-of-the-box functionality.
Consul Connect Review
Our next contender, Consul Connect, presents a distinctive hybrid approach. HashiCorp’s Consul is widely recognized for its key-value store designed for distributed architectures, a tool that has been around for many years. As Consul evolved into a comprehensive suite of service tools, HashiCorp made the decision to build a service mesh on top of it: Consul Connect.
To clarify its hybrid nature:
- Consul Connect’s data plane is powered by Envoy, which is written in C++.
- The control plane of Consul Connect is implemented in Go. This component is underpinned by Consul KV, the key-value store.
Like most other service meshes, Consul Connect injects a sidecar proxy into your application pod. Architecturally, Consul Connect centers around the concepts of agents and servers. Out of the box, Consul Connect is engineered for high availability (HA), employing three or five servers as a StatefulSet with pod anti-affinity configured. Pod anti-affinity ensures that pods belonging to a distributed software system won’t end up on the same node (server), guaranteeing availability in case of a single node failure.
Connectivity
Consul Connect doesn’t offer many standout features in this area; it provides the expected capabilities of any service mesh (which is still substantial), along with layer-seven features like path-based routing, traffic shifting, and load balancing.
Security
Similar to its counterparts, Consul Connect offers standard mTLS capabilities. It also boasts native integration between Consul and Vault (another HashiCorp product). Vault can function as a certificate authority (CA) provider to manage and sign certificates within a cluster.
Observability
Consul Connect adopts a common approach to observability by integrating Envoy as a sidecar proxy to enable layer-seven capabilities. Configuring Consul Connect’s UI to retrieve metrics involves modifying a built-in configuration file and activating a metrics provider like Prometheus. You can also set up Grafana dashboards to visualize relevant service-specific metrics.
Installation
Installing Consul Connect into a Kubernetes cluster is done using a Helm chart:
| |
You will need to adjust the default values.yaml file if you intend to use the UI or enable the Consul Connect module to inject its sidecar proxy:
| |
To inspect Consul members and check the various nodes, HashiCorp recommends using the exec command to access one of the containers and then utilizing the consul CLI tool.
To access the default web UI provided by Consul, execute the command kubectl port-forward service/hashicorp-consul-ui 18500:80.
Consul Connect Service Mesh Summary
Advantages:
- Consul is backed by HashiCorp; being a freemium product, it offers an enterprise version with additional features and enterprise-level support. In terms of development team experience, Consul is one of the most established tools in the market.
- Consul has a strong enterprise user base and is known to run efficiently on infrastructures with as many as 50,000 nodes. Having been around since 2014, it’s a mature product in its own right.
- Consul Connect operates seamlessly within a VM environment thanks to its native support.
- Consul Connect enables deep application integrations, rivaling the pre-service-mesh implementations seen at leading tech companies. This is possible due to its well-documented, library-level API.
Drawbacks:
- Consul Connect has a steeper learning curve compared to other service meshes and requires more tuning to configure visual dashboards and metrics effectively.
- HashiCorp’s documentation isn’t always straightforward, often requiring users to experiment and dig deeper to achieve the desired configuration.
- Finding documentation on traffic management can be challenging, and it mostly consists of links redirecting to Envoy’s documentation, which lacks specifics about Consul Connect’s traffic management implementation.
- The SMI interface within Consul Connect is still in an experimental phase.
Consul Connect can be an excellent option for organizations seeking a production-ready, enterprise-grade solution. HashiCorp is renowned for the quality of its products, and Consul Connect is no exception. Two key advantages stand out compared to other service meshes: robust support from HashiCorp with its enterprise version and compatibility with various architectures (not limited to Kubernetes).
Istio Review
In May 2017, a joint effort by Google, IBM, and Lyft brought Istio into existence. Istio’s entrance into the service mesh landscape garnered significant attention within the tech community. Driven by user feedback, its creators have continuously added features, reaching version 1.9 as of this writing.
Istio initially promised key advancements over its competitors at the time: automatic load balancing, fault injection, and more. While this generated substantial interest, as we’ll explore, deploying Istio is far from simple: it has gained a reputation for being particularly complex to implement in production.
Historically, the Istio project has seen frequent changes in its source code. After adopting a microservices architecture for its control plane, Istio has since shifted back to a monolithic architecture, starting with version 1.5. The rationale behind this move back to centralization was attributed to the difficulty operators faced in monitoring the microservices, excessive code redundancy, and the fact that the project had reached organizational maturity—it no longer required numerous small teams working in isolation.
However, during this period, Istio also became known for having a high volume of open GitHub issues. As of now, there are approximately 800 open issues and around 12,000 closed issues. While issue counts can be misleading, in Istio’s case, they signify considerable progress in addressing previously malfunctioning features and uncontrolled resource consumption.
Connectivity
In the realm of traffic management, Istio stands out as particularly robust compared to Consul Connect and Linkerd. This strength stems from its extensive array of sub-features: request routing, fault injection, traffic shifting, request timeouts, circuit breaking, and control over both ingress and egress traffic within the service mesh. The concepts of virtual services and destination rules contribute to its comprehensive traffic management capabilities.
However, this vast feature set comes with a learning curve and the added responsibility of managing these new resources within your Kubernetes cluster.
Security
Istio boasts a comprehensive suite of security tools centered around two main areas: authentication and authorization. It allows for the enforcement of varying policy levels across different scopes: workload-specific, namespace-wide, or mesh-wide. All these security resources are managed through Istio CRDs such as AuthorizationPolicy or PeerAuthentication.
Beyond the standard mTLS support, Istio can be configured to allow or deny unencrypted traffic.
Observability
Istio excels in this area, offering advanced observability out of the box. It provides several telemetry types, offering valuable insights into the service mesh. Metrics are based on the four golden signals (latency, traffic, errors, and, to an extent, saturation).
Notably, Istio provides metrics for its own control plane. It also delivers distributed traces and access logs and explicitly supports integration with Jaeger, Lightstep, and Zipkin for tracing purposes.
While it lacks a built-in dashboard, Istio offers official support for the Kiali management console.
Installation
Installation is as simple as following the steps outlined in the official steps. Istio is also natively integrated into GKE as a beta feature. However, GKE currently uses Istio 1.4.X, the older microservices-based version, as opposed to the latest monolithic version.
A typical installation begins by downloading the most recent release:
| |
After navigating to the newly created istio-* directory using the cd command, you can add it to your system path. This allows you to use the istioctl utility tool directly:
| |
With that done, you can proceed to install Istio into your Kubernetes cluster using the istioctl command:
| |
This will install Istio using the default profile. istioctl profiles enable you to create and switch between different installation configurations. Even with a single profile, you can deeply customize the installation process of Istio by customizing specific CRDs.
Managing Istio resources can be more demanding, as you’ll need to handle various types of CRDs—VirtualService, DestinationRule, and Gateway, at a minimum—to ensure proper traffic management.
- A
VirtualServiceresource is a configuration file that defines a service and its associated routing rules for incoming requests. - A
DestinationRuleresource serves to group and enforce traffic policies specific to a target service. - A
Gatewayresource manages inbound and outbound traffic for the service mesh (essentially acting as additional Envoy proxies, but positioned at the edge rather than as sidecars).
While a thorough discussion of the semantic details is beyond the scope of this review, let’s examine a brief example demonstrating how these components work together. Consider an e-commerce platform with a service named products. The VirtualService might look like this:
| |
The corresponding DestinationRule could then be:
| |
Finally, the Gateway configuration:
| |
With these three configuration files in place, an Istio installation would be ready to handle basic traffic routing.
Istio Service Mesh Summary
Advantages:
- Among the various service meshes available, Istio boasts the largest online community as of today. With over ten times the number of Stack Overflow results compared to its main competitors, it’s arguably the most discussed service mesh online; its GitHub contributor base is similarly an order of magnitude larger than Linkerd’s.
- Istio supports both Kubernetes and VM environments; the VM mode is currently in beta as of version 1.9.
Drawbacks:
- Istio isn’t free, in two senses:
- It demands a considerable time investment to understand its documentation, set it up correctly, ensure it functions properly, and maintain it effectively. Depending on the infrastructure’s scale and the number of services involved, Istio can require several weeks to several months of dedicated work to become fully operational and integrated into a production environment.
- It also introduces substantial resource overhead: It requires around 350 millicores (mCPU) per Envoy container for every 1,000 requests per second (RPS) handled. Even the control plane itself can consume a significant amount of resources. (Previously, its resource usage was unpredictable, but with optimization efforts,
istiodhas stabilized around using approximately 1 vCPU and 1.5 GB of memory.)
- It lacks a native administration dashboard, unlike Linkerd.
- Istio mandates the use of its own ingress gateway.
- The Istio control plane is restricted to Kubernetes containers (it doesn’t offer a VM mode, unlike Istio’s data plane).
Istio exemplifies the potential of collaboration among tech giants to create an open-source project addressing a shared challenge. It took time for the Istio project to mature in terms of structure (evidenced by its shift from microservices to a monolithic architecture) and resolve numerous initial issues. Today, Istio delivers a comprehensive set of features expected from a service mesh and offers significant extensibility. However, this vast functionality comes at the cost of steep requirements in terms of expertise, time commitment, and computing resources to support its use in production.
Kuma Quick Review
Created and subsequently open-sourced by Kong, Kuma achieved version 1.0 in late 2020. To some extent, its development was a response to the initial complexity and operational challenges presented by early service meshes.
Kuma’s feature set emphasizes modularity; its design focuses on seamless integration with applications running on Kubernetes or other infrastructure.
- In the domain of traffic management, Kuma offers standard service mesh capabilities like fault injection and circuit breaking.
- Beyond mTLS encryption for inter-service communication, Kuma secures exchanges between the data plane and control plane using a data plane proxy token.
- Kuma defines observability through various traffic policies focused on metrics, tracing, and logging.
- Service discovery in Kuma is facilitated by its own internal DNS resolver, running on port 5653 of the control plane.
- Kuma places a strong emphasis on multimesh functionality: You can effortlessly combine several Kubernetes clusters or VM environments into a unified Kuma cluster using its multizone deployment type.
- Existing Kong users will appreciate Kuma’s easy integration with Kong Gateway.
The universal (non-Kubernetes) version of Kuma requires PostgreSQL as a dependency, and Kong’s CTO has publicly expressed reservations about supporting SMI. However, Kuma’s development from the outset prioritized multicloud and multicluster deployments, and its dashboard reflects this design choice.
While Kuma is relatively new to the service mesh landscape, with limited production use cases so far, it’s a promising and intriguing contender worth keeping an eye on.
Traefik Mesh Quick Review
Initially known as Maesh, Traefik Mesh (developed by Traefik Labs) is another recent addition to the world of service mesh tools. The project aims to make service meshes more accessible by simplifying their use and configuration; the developers’ experience with the well-regarded Traefik Proxy positions them well to achieve this goal.
- Traffic management features in Traefik Mesh include circuit breaking and rate limiting.
- Regarding observability, Traefik Mesh features native OpenTracing support and out-of-the-box metrics (the standard installation automatically includes Prometheus and Grafana), reducing setup time.
- For security—in addition to mTLS—Traefik Mesh adheres to SMI specifications and allows for granular control over traffic permissions through access control mechanisms.
Traefik Mesh requires CoreDNS to be installed within the cluster. (While Azure has used CoreDNS as its default since version 1.12, GKE still defaults to kube-dns as of this writing, adding an extra step for GKE users.) It currently lacks multicluster capabilities.
However, Traefik Mesh stands out in our comparison by forgoing sidecar injection. Instead, it’s deployed as a DaemonSet across all nodes, acting as a proxy between services without directly modifying application deployments. Overall, Traefik Mesh prioritizes ease of installation and use.
AWS App Mesh Quick Review
In the realm of cloud providers, AWS was the first to implement a native service mesh that integrates with both Kubernetes (specifically EKS) and its other services. Released in November 2018, AWS App Mesh has seen continuous development from AWS. Its primary advantage lies in its integration with the existing AWS ecosystem and AWS’s dominant market position; the large AWS community is expected to drive its adoption and usability.
- Traffic management in AWS App Mesh includes circuit breaking alongside other common features.
- As a service hosted by AWS, AWS App Mesh is fully managed, eliminating concerns about resource management and control plane availability.
- Observability within AWS App Mesh can be achieved through Prometheus or AWS X-Ray.
However, the project is not open source, lacks SMI support, and information regarding HA standards for its control plane is scarce. AWS App Mesh is more complex to set up than other Kubernetes-native service meshes and has a relatively small online community (24 answers on Stack Overflow, 400 stars on GitHub). This is primarily because users are expected to rely on AWS support channels.
AWS App Mesh offers native integration with various AWS services, starting with EKS and extending to other services like ECS (Fargate) and EC2. Unlike Traefik Mesh, it supports multicluster deployments. Moreover, like many service meshes, it leverages the robust Envoy sidecar proxy.
Kubernetes Service Mesh Comparison Tables
The six Kubernetes service mesh solutions examined here share several commonalities:
- Protocol Support: They all function seamlessly with HTTP, HTTP/2, gRPC, TCP, and WebSockets.
- Basic Security: They all incorporate default basic security measures through mTLS between proxies.
- Load Balancing: Service meshes inherently provide some form of load balancing.
- Request Retrying: All six options include a request retrying feature as part of their traffic management capabilities.
- Service Discovery: This is a core functionality offered by all service meshes.
However, notable differences exist in their implementation of service mesh infrastructure, traffic management, observability, deployment, and other areas.
Infrastructure
| Linkerd | Consul | Istio | Kuma | Traefik Mesh | AWS App Mesh | |
|---|---|---|---|---|---|---|
| Platforms | Kubernetes | Kubernetes, VM (Universal) | Kubernetes; VM (Universal) is in beta as of 1.9 | Kubernetes, VM (Universal) | Kubernetes | AWS EKS, ECS, FARGATE, EC2 |
| High Availability for Control Plane | Yes (creates exactly three control planes) | Yes (with extra servers and agents) | Yes (through Horizontal Pod Autoscaler [HPA] on Kubernetes) | Yes (horizontal scaling) | Yes (horizontal scaling) | Yes (by virtue of supporting AWS tech being HA) |
| Sidecar Proxy | Yes, linkerd-proxy | Yes, Envoy (can use others) | Yes, Envoy | Yes, Envoy | No | Yes, Envoy |
| Per-node Agent | No | Yes | No | No | Yes | No |
| Ingress Controller | Any | Envoy and Ambassador | Istio Ingress or Istio Gateway | Any | Any | AWS Ingress Gateway |
Traffic Management
| Linkerd | Consul | Istio | Kuma | Traefik Mesh | AWS App Mesh | |
|---|---|---|---|---|---|---|
| Blue-green Deployment | Yes | Yes (using traffic splitting) | Yes | Yes | Yes (using traffic splitting) | Yes |
| Circuit Breaking | No | Yes (through Envoy) | Yes | Yes | Yes | Yes |
| Fault Injection | Yes | No | Yes | Yes | No | No |
| Rate Limiting | No | Yes (through Envoy, with the help of official Consul docs) | Yes | Not yet, except by configuring Envoy directly | Yes | No |
Observability
| Linkerd | Consul | Istio | Kuma | Traefik Mesh | AWS App Mesh | |
|---|---|---|---|---|---|---|
| Monitoring with Prometheus | Yes | No | Yes | Yes | Yes | No |
| Integrated Grafana | Yes | No | Yes | Yes | Yes | No |
| Distributed Tracing | Yes (OpenTelemetry*) | Yes | Yes (OpenTelemetry*) | Yes | Yes (OpenTelemetry*) | Yes (AWS X-Ray or any open-source alternative) |
* It’s worth noting that OpenCensus and OpenTracing merged to form OpenTelemetry in 2019. You might still come across Linkerd articles referring to OpenCensus, as well as Istio and Traefik Mesh articles mentioning OpenTracing.
Deployment
| Linkerd | Consul | Istio | Kuma | Traefik Mesh | AWS App Mesh | |
|---|---|---|---|---|---|---|
| Multicluster | Yes (recently) | Yes (federated) | Yes | Yes (multizone) | No | Yes |
| Mesh expansion | No | Yes | Yes | Yes | No | Yes (for AWS services) |
| GUI | Yes (out of the box) | Yes (Consul UI) | No native GUI but can use Kiali | Yes (native Kuma GUI) | No | Yes (through Amazon CloudWatch) |
| Deployment | via CLI | via Helm chart | via CLI, via Helm chart, or via operator container | via CLI, via Helm chart | via Helm chart | via CLI |
| Management Complexity | Low | Medium | High | Medium | Low | Medium |
Other Service Mesh Considerations
| Linkerd | Consul | Istio | Kuma | Traefik Mesh | AWS App Mesh | |
|---|---|---|---|---|---|---|
| Open Source | Yes | Yes | Yes | Yes | Yes | No |
| Exposed API | Yes, but not documented | Yes, and fully documented | Yes, entirely through CRDs | Yes, and fully documented | Yes, but intended for debugging (GET-only); also, SMI via CRDs | Yes, and fully documented |
| SMI Specification Support | Yes | Yes (partial) | Yes | No | Yes | No |
| Special Notes | Needs PostgreSQL to run outside of Kubernetes | Needs CoreDNS installed on its cluster | Fully managed by AWS |
Should You Use a Kubernetes Service Mesh?
Having explored what service meshes are, their mechanisms, and the diverse approaches they take, a crucial question arises: Do you actually need a service mesh?
This question has been central for SREs and cloud engineers in recent years. While microservices present operational challenges in network communication that a service mesh can effectively address, service meshes often bring their own set of challenges related to installation and ongoing operation.
A recurring issue observed in various projects is the gap between the proof-of-concept stage and actual production deployment when working with service meshes. It’s unfortunate, but many companies struggle to create staging environments that perfectly mirror their production setups in every aspect. When service meshes are involved—given their critical role in infrastructure—discrepancies related to scale and edge cases can lead to unforeseen issues during deployment.
The field of service meshes is still rapidly evolving and improving. This dynamic nature can be appealing for teams with high deployment velocities—those who have mastered staying at the forefront of technology and can closely track the development cycles of cloud-native tools.
However, for others, the rapid pace of service mesh evolution might pose challenges. It’s easy to set up a service mesh and then neglect its maintenance needs. Security patches might be overlooked, or even if applied, could introduce unintended consequences in the form of deprecated features or changes in dependencies.
There’s also a considerable cost in terms of manpower required to successfully deploy a service mesh in a production environment. It’s crucial for any team to assess this cost and determine if the benefits offered by a service mesh outweigh the initial setup time and effort. Service meshes, despite the apparent simplicity of “easy” demo installations, can be complex to manage effectively.
In essence, while service meshes offer solutions to common challenges faced by projects deployed at scale, they can also introduce new complexities. Be prepared to invest the necessary time and resources. In a hypothetical scenario involving 25 microservices and a load of five queries per second, it’s advisable to allocate at least one dedicated engineer (preferably two) for a minimum of one month to develop a proof of concept and validate key aspects before considering a production rollout. Once deployed, anticipate frequent upgrades—these will directly impact a core component of your infrastructure: network communication.
Kubernetes Service Meshes: A (Complex) Step Forward in Scalable Application Architecture
We’ve established that service meshes are a collection of tools designed to tackle the new challenges posed by microservices architecture. By addressing traffic management, observability, service discovery, and security enhancements, service meshes can provide deep insights into your application infrastructure.
Multiple players exist in the market, some backed by tech giants like those within GAFAM, who have open-sourced or promoted their internally developed tooling. Despite two primary implementation models, all service meshes share common ground: a control plane acting as the system’s brain and a data plane composed of proxies that intercept and manage your application’s requests.
Through our review of the three most popular service meshes (Linkerd, Consul Connect, and Istio), we’ve highlighted their distinct implementation strategies and advantages. Linkerd, the oldest player in the field, benefits from the experience its creators gained at Twitter. HashiCorp provides the enterprise-ready Consul Connect, backed by extensive expertise and robust support. Istio, initially met with significant online attention, has matured into a comprehensive platform, delivering a feature-rich solution.
However, these are not the only contenders, and several less-discussed service meshes have emerged: Kuma, Traefik Mesh, and AWS App Mesh, to name a few. Kong’s Kuma aims to simplify the service mesh concept and make it adaptable to any system, not just Kubernetes. Traefik Mesh leverages learnings from the existing Traefik Proxy and takes a unique approach by avoiding sidecar proxies. AWS has also entered the arena with its own service mesh implementation, relying on the dependable Envoy sidecar proxy.
In reality, implementing service meshes effectively remains a challenge. While their benefits are compelling, their impact is significant and double-edged: A malfunctioning service mesh can disrupt communication between your microservices, potentially bringing down your entire application stack. A notable example of this is the incompatibility issue between a specific Linkerd version and a Kubernetes version, which led to a complete production outage at Monzo, an online bank.
Despite these challenges, the industry is increasingly adopting Kubernetes and initiatives like the Microsoft-spearheaded SMI, a standard interface designed for service meshes operating on Kubernetes. The Cloud Native Computing Foundation (CNCF) is involved in numerous projects in this space, including the Envoy-based Open Service Mesh (OSM) initiative, which received notable originally introduced from Microsoft. The service mesh ecosystem remains dynamic, and a clear leader is likely to emerge in the coming years, mirroring Kubernetes’ rise as the de facto container orchestration tool. For now, the insights provided in this article should help you navigate the landscape and select the service mesh best suited to your needs.