In the constantly evolving world of software development, database programming stands out for its stability. While application programming interfaces (APIs) change frequently, requiring developers to constantly update their code, database fundamentals remain consistent. A SQL query written years ago will still function correctly today. This is not to say that database programming hasn’t advanced; however, these advancements have been more focused on enhancing logic and efficiency rather than fundamental changes.
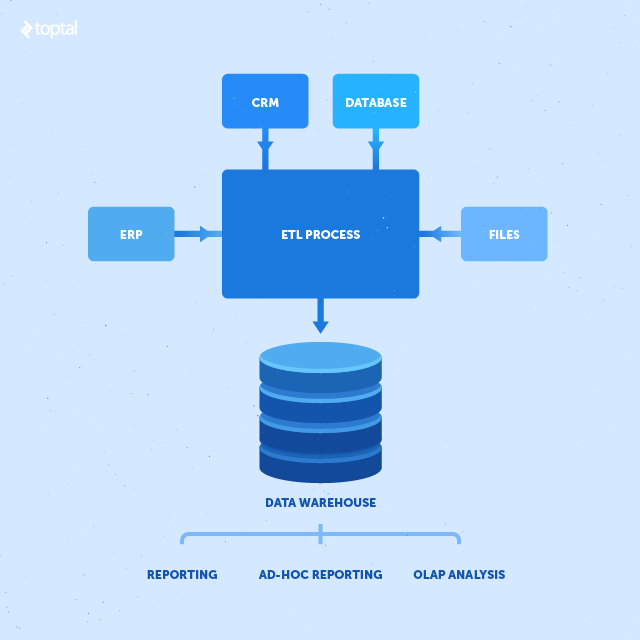
Inspired by the groundbreaking theories of Bill Inmon and Ralph Kimball on data warehouse design, database programming has evolved to prioritize the preservation and extraction of valuable data. Their introduction of data warehousing revolutionized the field, leading to significant advancements in ETL (Extract/Transform/Load) tools. These advancements made it easier for developers to access and integrate data from various sources, including non-relational databases, which were previously difficult to work with. The increased availability of data further fueled advancements in data processing techniques, such as OLAP cubes and data mining algorithms.
Integrating a data warehouse, OLAP cubes, and data mining algorithms into your database architecture can significantly optimize business processes and reveal hidden patterns within your data. Automation can also play a crucial role in bolstering business intelligence capabilities.
However, before adopting new tools and technologies, it is essential to ensure that the foundation of your database, the transaction database, is robust and reliable.
Transaction Database: The Foundation
The transaction database forms the bedrock of your data infrastructure. If it lacks reliability and accuracy, any additions built upon it are prone to failure.
When adding layers to your database, always prioritize projects that demonstrate a clear return on investment. Maximize the potential of your existing architecture before introducing additional layers. Since all these layers depend on data from the transaction database, you can often achieve the desired outcome by simply querying the transaction database directly. While utilizing a data warehouse or OLAP cube for reporting is ideal, meeting basic reporting needs takes precedence, especially if an organization is not prepared for increased complexity. Once basic reporting requirements are met, it becomes easier to advocate for a proper data warehouse and potentially an OLAP cube.
Most programmers are familiar with the three principles of database normalization. Stored procedures that access the transaction database present opportunities for optimization. Focus on enhancing readability, minimizing calls to the same database table, and eliminating unnecessary variable usage.
Experienced database programmers prioritize the readability of their stored procedures. They typically follow consistent formatting conventions, such as using uppercase for keywords and aggregate functions, camelcase or underscores for table and field names, and meaningful table aliases. The alignment of stored procedure sections often follows a block pattern.
Here’s an example of a query formatted for readability:
| |
Another aspect to consider is whether a query accesses the same table multiple times. In most cases, accessing a table once is sufficient, except in rare scenarios where aggregating another aggregate function is necessary. Multiple table accesses, while not necessarily resulting in inaccurate data, can impact query performance.
Furthermore, unnecessary joins can lead to dropped or duplicated records, compromising the accuracy of your queries. Similarly, the excessive use of variables suggests that the query was written from an application development perspective rather than a database perspective. Application developers often rely heavily on variables, while database queries rarely require them, except when declared as parameters for stored procedures.
ETL (Extract Transform Load) and Reporting: Streamlining Business Processes
Once a client’s transaction database has efficient and well-structured queries, the focus can shift to streamlining business processes.
One way to identify the need for ETL processes or automated reporting is to observe how end-users interact with data. If they are extracting data from the transaction database and manipulating it in spreadsheets, it suggests an opportunity for automation.
Automating these processes offers an immediate return on investment. However, it’s important to note that while developers embrace automation, end-users might resist it, especially if it jeopardizes their roles. Therefore, proactively identifying and suggesting automation opportunities is crucial.
A well-designed ETL system should also provide data lineage, allowing you to track data back to its original source. This is critical for data quality management. If you cannot trace the origin of data, including the date/time of entry and the source (user or filename), you are ill-equipped to handle inaccurate data.
Data Warehouse: Inmon vs. Kimball
There are two prominent approaches to data warehouse design: the Inmon approach and the Kimball approach.
- The Inmon approach advocates for building the data warehouse first and then creating dimensional data marts for reporting purposes.
- The Kimball approach suggests developing dimensional data marts first and then merging them to create the data warehouse.
Prioritizing client ROI is paramount. Building data marts is a relatively straightforward process. It involves modifying existing report queries to store result sets in permanent tables instead of just returning them. This can be achieved by adding TRUNCATE TABLE tablename; INSERT INTO tablename before the original SELECT statement. As you create functional data mart tables, opportunities for merging them will emerge. Look for report queries that utilize similar tables and consolidate their fields. While this requires more complex queries, especially as the number of tables increases, incremental changes, coupled with thorough testing, allow for seamless integration without disrupting normal business operations.
The Kimball approach offers the advantage of showcasing ROI to the client with each enhancement. This is because the data marts are built iteratively, allowing for immediate value demonstration.
OLAP Cube: Power and Complexity
An OLAP cube can benefit an organization by providing:
- Aggregated data with fast response times
- Ad-hoc drill-down capabilities for end-users
- Enhanced data mining capabilities
An OLAP cube allows you to extract maximum value from your data. However, building and maintaining an OLAP cube can be complex and expensive, as it requires specialized knowledge of the MDX language and involves intricate configuration compared to a standard database server.

Sometimes, existing OLAP cubes are underutilized, with only basic dashboards leveraging their capabilities. Many processes they handle could be effectively replaced by SQL queries, a data warehouse, or canned reports. While an OLAP cube can provide faster response times than canned reports, the difference is often negligible. Similarly, the drill-down capabilities, while beneficial, can often be replicated using well-designed canned reports that offer a similar ad-hoc interface.
Before committing to an OLAP cube, it’s advisable to explore alternative solutions like canned reports to understand end-user reporting needs better. This approach allows you to identify commonly used ad-hoc queries, which can then be transformed into canned reports, potentially fulfilling requirements that users were not aware could be met through canned reports.
Given that response time and drill-down improvements offered by an OLAP cube are often minimal, it’s best to recommend it to a client only when their data analysis needs demand robust data mining capabilities. That’s when an OLAP cube can truly shine, revealing hidden insights that would otherwise remain undiscovered.
As previously mentioned, building an OLAP cube can be challenging. Consider exploring hybrid OLAP solutions like Microsoft Excel’s PowerPivot, which provides user-friendly data mining tools without the complexity of a full-fledged OLAP cube. While hybrid solutions might not offer the same response times, they compensate by simplifying the creation of data mining reports using familiar tools like Excel.
When it comes to data mining, there are three valuable report types, illustrated with real-world examples from an automated day trading application:
Visual Reporting: Insights at a Glance
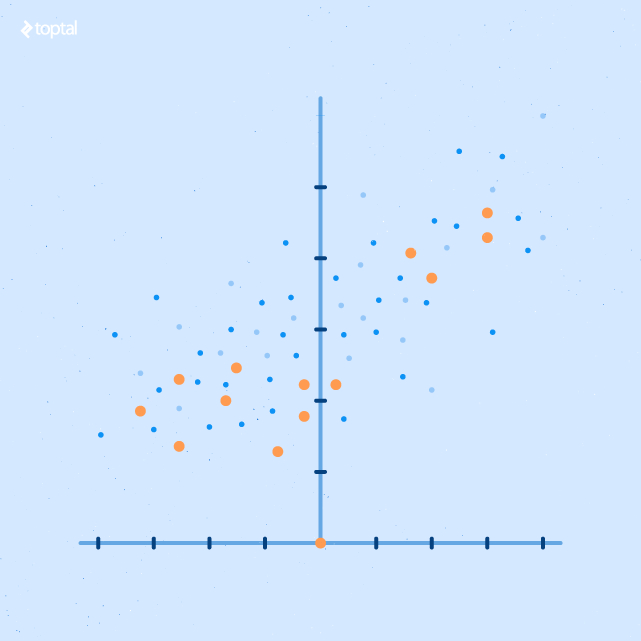
Scatter Plot Report
A scatter plot report provides a detailed view by comparing two variables. Incorporating color and size into the dots enhances the visualization of outcomes in relation to those variables.
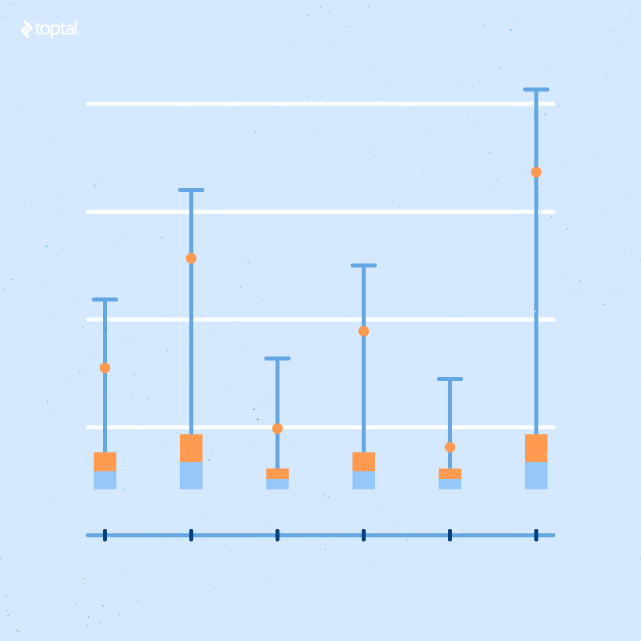
Box and Whiskers Report
This report summarizes the x and y values from the scatter plot report. The x-axis values are grouped into buckets.
The ends of each whisker (line) represent outliers. The yellow and light blue bars show the upper and lower one standard deviation ranges.
Linear Regression Model
This report reveals the correlation between the x and y axis values, including a smoothed line that can be represented mathematically. The R-squared value indicates the reliability of the correlation.

Conclusion: The Value of Database Expertise
As your organization expands, so too will its database requirements. While smaller organizations might manage with their IT staff handling multiple responsibilities, including database management, there comes a point where specialized expertise becomes essential.
This document has highlighted common database issues and provided insights into building robust data mining tools without relying heavily on expensive software licenses. This knowledge should provide a clearer understanding of how a dedicated database professional can significantly benefit your organization.