From the earliest interactions, social connections have formed the basis of networks, making the widespread adoption of online social networks in our hyperconnected world an unsurprising development.
Among these platforms, Twitter stands out, often dubbed “the SMS of the Internet” due to its remarkable rise over the past decade. Launched in 2006, it quickly gained global traction and has become one of the ten most visited websites worldwide. As of May 2015, Twitter boasts 302 million active users, who collectively generate 500 million Tweets daily, and these figures continue to climb.
This massive volume of social media content has positioned Twitter as a goldmine of information for analysts, particularly in data mining, social network analysis, and gauging public sentiment on political and social issues. Trend topics on Twitter are proving increasingly valuable to data science firms as a reliable indicator of public opinion.

This article outlines the methods I used for a proof-of-concept project that successfully analyzed Twitter Trend Topics to anticipate regional voting behaviors in the 2014 Brazilian presidential election as a test case.
The Election
Brazil held its General presidential elections on October 5, 2014. Since no candidate secured over 50% of the votes, a runoff election took place on October 26th.
In the initial round, Dilma Rousseff (Partido dos Trabalhadores) secured 41.6% of the vote, leading over Aécio Neves (Partido da Social Democracia Brasileira) with 33.6%, and Marina Silva (Partido Socialista Brasileiro) with 21.3%. The runoff on October 26th saw Rousseff and Neves vying for the presidency, with Rousseff securing a narrow victory, 51.6% to Neves’ 48.4%. This article’s analysis focuses specifically on the October 26th runoff election.
Partido dos Trabalhadores (PT) is a prominent political party in Brazil, representing both the current and former presidents, Dilma Rousseff and Luis Inacio Lula da Silva. Partido da Social Democracia Brasileira (PSDB) is the political party of former president Fernando Henrique Cardoso.
Data Mining and Twitter Trend Topic Data Extraction
My social media data mining process involved collecting Twitter Trend Topic data for 14 Brazilian cities accessible through the Twitter API: Brasília, Belém, Belo Horizonte, Curitiba, Porto Alegre, Recife, Rio de Janeiro, Salvador, São Paulo, Campinas, Fortaleza, Goiânia, Manaus, and São Luis.
I utilized the Twitter REST API to retrieve the top 10 Twitter Trend Topics for these cities at 20-minute intervals (due to limitations imposed by Twitter’s API). Specifying their Yahoo! GeoPlanet WOEIDs (Where On Earth IDs) allowed me to narrow the query to these 14 cities.
For this pilot project, I employed Python and a Twitter library (cleverly called “twitter”) to gather social network data for the runoff election day (Oct 26th) and the two preceding days (Oct 24th and 25th). I conducted around 70 distinct queries each day to pinpoint real-time trend topics.
Below is a sample JSON object returned for a query (based on October 26th at 12:40:00 AM, showing data for Belo Horizonte).
| |
A Glimpse into Social Network Analysis
Social Network Theory delves into how individuals, entities, or groups interact within their networks. Social networks primarily fall into three categories:
- Egocentric networks center around a single node or individual (e.g., you and your network of friends and family).
- Socio-centric networks represent closed networks, like students in a classroom or employees within an organization.
- Open system networks lack clearly defined boundaries, making them generally more challenging to analyze. The socio-political network examined in this article exemplifies an open system network.
Social networks are considered complex networks due to their non-trivial topological features, exhibiting connection patterns that are neither entirely regular nor random.
Social network analysis investigates the relationships between social entities. These entities are often individuals but can also encompass social groups, political organizations, financial systems, community residents, citizens of a nation, and more. The empirical study of networks has been central to social science, with many mathematical and statistical tools for network analysis originating in sociology.
Constructing the Network
I established the following rules to construct a network from Twitter Trend Topics:
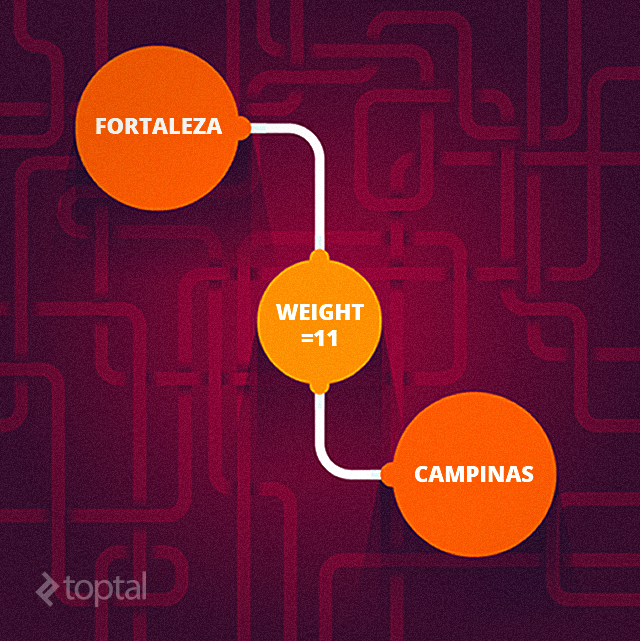
- Each city represents a vertex (or node) in the network.
- An edge (or link) exists between two cities if they share at least one common trend topic.
- The weight of each edge corresponds to the number of shared trend topics between the cities (more shared topics translate to a stronger link).
For instance, on October 26th, Fortaleza and Campinas shared 11 trend topics, resulting in an edge with a weight of 11 between them in that day’s network:
To refine the relationship weights between cities, I considered non-election-related topics, assuming that cities with shared interests and priorities might exhibit similar political inclinations.
While the trend topics’ order could hold analytical significance, I disregarded it in this simplified proof-of-concept.
Network Topology
Network topology refers to the arrangement of elements (links, nodes, etc.) within a network. The network topology in our analysis remains relatively consistent over the 3 days, as the nodes (14 cities) are fixed. However, variations in link weights occur due to fluctuations in shared trend topics, as illustrated in the comparison of network topology between Day 24 and Day 25:

Predicting Election Outcomes with Twitter Trend Topic Data
To predict election outcomes, we factored in not only shared trend topics but also how their content reflected potential support for the two main political parties: Partido dos Trabalhadores (PT) and Partido da Social Democracia Brasileira (PSDB).
Initially, I compiled a list of terms and phrases perceived to indicate positive sentiment or support for each party. (While this task is inherently complex, I opted for a simplified approach for this proof-of-concept. The resulting accuracy is noteworthy, as a more refined list would likely yield even better results.)
Then, for each node, I tallied:
- the number of links containing terms suggestive of PT support
- the number of links containing terms suggestive of PSDB support
Taking Fortaleza as an example, the counts were as follows:
| |
This suggests a general preference for Partido dos Trabalhadores (PT) among Fortaleza residents.
Results and Conclusions
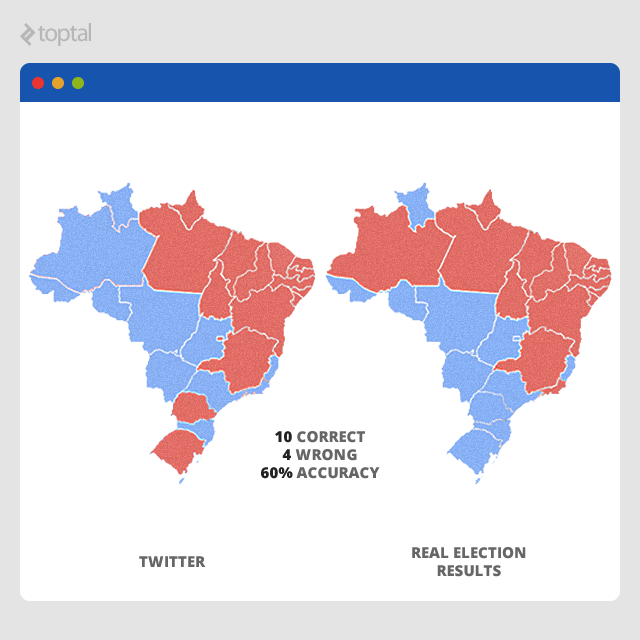
Remarkably, the analysis yielded results closely aligned with the actual election outcomes, especially considering our simplified approach. Here’s a comparison of the predictions based on Twitter Trend Topic data and the real election results (red represents Partido dos Trabalhadores, and blue represents Partido da Social Democracia Brasileira):
Greater scientific rigor, along with more sophisticated algorithms and metrics, would undoubtedly enhance the results further.
For instance, metrics like the following could be used to determine a node’s importance or influence, informing this type of predictive analysis:
Node centrality. Various node centrality measures can help identify the most influential nodes in a network. Betweenness centrality, for example, considers a node highly important if it bridges many other nodes, while eigenvalue centrality bases importance on connections to other highly important nodes.
Clustering coefficient. A node’s clustering coefficient quantifies the degree of interconnectedness among its “neighbors,” offering insights into a node’s potential influence.
Degree centrality. This basic measure of a node’s significance within a network relies on the number of links connected to it.
Even without such sophistication, this proof-of-concept demonstrates the potential of using Twitter Trend Topic data for effective predictive analysis, paving the way for even more advanced social media data analysis in the future.