It’s safe to say that not all Ruby developers are fortunate enough to avoid memory-related problems. For many of us, identifying and resolving memory issues in Ruby applications can feel like searching for a needle in a haystack. The good news is that modern Ruby versions (2.1 and later) offer powerful tools and strategies for tackling these common headaches. While I might be in the minority, I find the process of memory optimization to be both engaging and satisfying.

It’s important to remember that optimization often comes at the cost of increased code complexity. Therefore, it’s crucial to ensure that any optimization efforts result in measurable and significant improvements to justify the added complexity.
The examples provided in this discussion are based on the standard MRI Ruby, specifically version 2.2.4. However, other versions of Ruby 2.1 and later should exhibit similar behavior.
Don’t Jump to “Memory Leak”!
When encountering a memory problem, it’s easy to assume a memory leak. For example, in web applications, you might observe that memory usage steadily climbs with each request to the same endpoint after the server starts. While genuine memory leaks can occur, many memory issues mimic this pattern without actually being leaks.
Consider a simplified Ruby code snippet that repeatedly constructs and discards a large array of hashes. Let’s begin with some code that will be used across various examples in this post:
| |
Now, let’s look at the array builder:
| |
We’ll use the [get\_process\_mem](https://github.com/schneems/get_process_mem) gem, a handy tool for retrieving memory usage information for the current Ruby process. As anticipated, we observe a continuous rise in memory consumption, just like the scenario described earlier.
| |
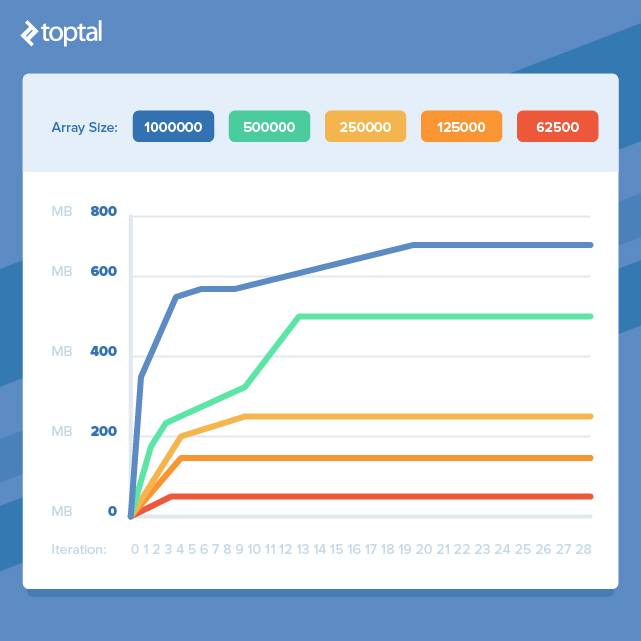
However, as we execute more iterations, we’ll eventually reach a plateau.
| |
Reaching this plateau is a clear indicator that we’re not dealing with a true memory leak or that any potential leak is insignificant compared to the overall memory usage. The intriguing question is why memory usage continues to grow after the initial iteration. We created a substantial array but immediately discarded it and started building a new one of the same size. Shouldn’t it reuse the memory space freed up by the previous array? Unfortunately, the answer is no, and this explains our issue.
Except for garbage collector tuning, you lack direct control over its execution timing. In the build_arrays.rb example, new memory allocations are occurring before the garbage collector has had a chance to clean up our old, discarded objects.
It’s important to note that this isn’t a flaw in Ruby’s memory management. It’s a common characteristic of garbage-collected languages. To confirm this, I replicated a similar example in Go and observed comparable behavior. That said, certain Ruby libraries can make it easier to create this type of memory problem.
Breaking Down the Problem
If our work involves handling large datasets, are we destined to simply throw more RAM at the issue? Thankfully, no. If we revisit the build_arrays.rb example and reduce the array size, the memory usage plateau will also decrease proportionally.
This highlights an important point: by dividing our tasks into smaller chunks for processing and avoiding the simultaneous existence of too many objects, we can dramatically reduce our memory footprint. However, this often entails transforming elegant, concise code into more verbose code that achieves the same outcome but with improved memory efficiency.
Zeroing in on Memory Hotspots
In a real-world codebase, pinpointing the source of a memory issue is rarely as straightforward as in the build_arrays.rb example. Before delving into a fix, isolating the memory issue is crucial. It’s easy to make inaccurate assumptions about the root cause.

I typically employ two techniques, frequently in tandem, to track down memory issues: profiling the code without modification and observing memory usage while selectively disabling and enabling suspicious code sections. While I’ll use [memory\_profiler](https://github.com/SamSaffron/memory_profiler) for profiling here, other popular options include [ruby-prof](https://github.com/ruby-prof/ruby-prof) and [derailed\_benchmarks](https://github.com/schneems/derailed_benchmarks), which offers excellent Rails-specific features.
Let’s examine some code that consumes a significant amount of memory, where the biggest memory hog might not be immediately apparent:
| |
Using [get\_process\_mem](https://github.com/schneems/get_process_mem), we can quickly confirm that it does indeed use a lot of memory when dealing with a large number of Person records.
| |
Result:
| |
Inspecting the code reveals several potential memory-intensive steps: constructing a large string array, invoking #to_a on an Active Record relation to create a large array of Active Record objects (not ideal, but for demonstration purposes), and serializing the Active Record object array.
Let’s profile the code to pinpoint memory allocation hotspots:
| |
Notice that the input to run is 1/10th of the previous example’s value. This is because the profiler itself consumes a lot of memory and can lead to memory exhaustion when profiling already memory-intensive code.
The results file is extensive, providing insights into memory and object allocation and retention at the gem, file, and line levels. While there’s a wealth of information to analyze, let’s focus on a few interesting snippets:
| |
The highest number of allocations occur within Active Record, suggesting that either instantiating all the objects in the records array or serialization with #to_json is the culprit. Let’s test our memory usage without the profiler by disabling these suspects one by one. Since we can’t retrieve records without the serialization step, we’ll disable serialization first.
| |
Result:
| |
It appears that serialization is indeed the major memory consumer. The before/after memory delta drops by a substantial 81% when it’s skipped. Now, let’s see what happens if we prevent the creation of the large records array.
| |
Result:
| |
This also reduces memory usage, but the reduction is an order of magnitude smaller than disabling serialization. At this point, we’ve identified the primary culprits and can decide on optimization strategies based on this data.
Although this example was contrived, the approaches used are broadly applicable. Profiler results might not directly pinpoint the problematic code section and can be misinterpreted. Therefore, it’s always wise to validate findings by observing actual memory usage with and without specific code sections enabled. Next, we’ll examine some common scenarios where memory usage becomes a problem and explore optimization techniques.
Deserialization: Taming Data Inflow
Deserializing large volumes of data from formats like XML, JSON, or others is a frequent source of memory issues. Methods such as JSON.parse or Active Support’s Hash.from_xml offer great convenience. However, when dealing with substantial data loads, the resulting in-memory data structures can become massive.
If you have control over the data source, consider implementing filtering or pagination to limit the amount of data retrieved. However, when dealing with external or uncontrollable sources, an alternative approach is to use a streaming deserializer. For XML, one option is [Ox](https://github.com/ohler55/ox). For JSON, [yajl-ruby](https://github.com/brianmario/yajl-ruby) appears to offer similar functionality, though my experience with it is limited.
Let’s look at an example of parsing a 1.7MB XML file using Hash#from_xml.
| |
| |
A 1.7MB file resulting in 111MB of memory usage? This clearly won’t scale effectively. Now let’s see the streaming parser version:
| |
| |
This reduces memory consumption to a negligible amount and should handle significantly larger files without issues. The tradeoff is the introduction of 28 lines of handler code, which might seem error-prone and would ideally have tests written for it in a production environment.
Serialization: Efficient Data Output
As demonstrated in the memory usage hotspot section, serialization can be memory-intensive. Here’s the relevant snippet from people.rb from earlier:
| |
With 100,000 records in the database, we get:
| |
The problem with calling #to_json here is that it instantiates an object for each record before encoding it to JSON. Generating JSON on a record-by-record basis, so that only one record object exists at a time, significantly reduces memory usage. While popular Ruby JSON libraries don’t seem to handle this directly, a common recommendation is to construct the JSON string manually. The [json-write-stream](https://github.com/camertron/json-write-stream) gem offers a user-friendly API for this purpose. Converting our example looks like this:
| |
Once again, optimization has increased code size, but the result seems worthwhile:
| |
Embracing Laziness
Introduced in Ruby 2.0, lazy enumerators are a fantastic feature for improving memory efficiency when chaining methods on enumerators. Let’s begin with a non-lazy code example:
| |
Result:
| |

In this scenario, each step in the chain iterates over every element in the enumerator, generating an array that has the next method in the chain invoked on it, and so on. Now let’s introduce laziness by simply adding a lazy call to the enumerator obtained from times:
| |
Result:
| |
Finally, an example demonstrating a significant memory usage improvement without significant code bloat! Note that if we didn’t need to accumulate results at the end (e.g., if each item was saved to the database and could be discarded), memory usage would be even lower. To force evaluation of a lazy enumerable at the end of the chain, simply append a call to force.
Another point worth noting is that the chain starts with a call to times before lazy. This consumes minimal memory, as it merely returns an enumerator that generates an integer upon each invocation. Therefore, starting the chain with an enumerable instead of a large array, if possible, is beneficial.
One practical application of lazily feeding an enumerable into a processing pipeline is handling paginated data. Rather than fetching all pages into a single large array, they can be exposed through an enumerator that abstracts away the pagination details. Here’s a possible implementation:
| |
Conclusion
We’ve explored memory usage characteristics in Ruby, examined general tools for identifying memory issues, and discussed common problem areas and optimization techniques. The cases presented are not exhaustive and are influenced by my personal experiences. However, the most significant takeaway might be adopting a mindset that considers the memory implications of code.