When you’ve worked with clients on paid marketing for a while, you quickly learn that everyone has a different understanding of the field. Some clients are practically account managers themselves, some know the basics, and others are completely new to online marketing. It’s easy to accidentally overwhelm your points of contact by giving them too much data or using jargon they’re not familiar with. That’s why clear, concise, and personalized reporting on your campaigns’ successes (and failures!) is the foundation of a strong client relationship.

Personalized reports also make client communication easier and your check-in calls much smoother. No matter the client’s size or how long you’ve been working with them, better reporting makes for a stronger relationship. In this post, I’ll explain some of my favorite tools and methods for creating top-notch paid channel reports that clearly demonstrate your value to your clients.
1. Use the right tools
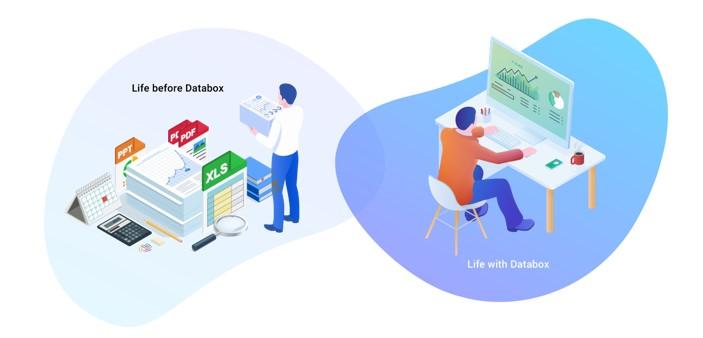
Creating compelling client reports starts with using the right tools to gather and present performance data. If you’re used to spreadsheets, you might hesitate to invest in something new. However, you could be spending far too much time pulling and presenting data every week or month—time you could save with real-time technology that does the same thing faster and better. Plenty of tools can make pulling and presenting performance data seamless and visually appealing. I’ll guide you through a few that I personally use, as well as some that other agency owners have recommended.
Databox
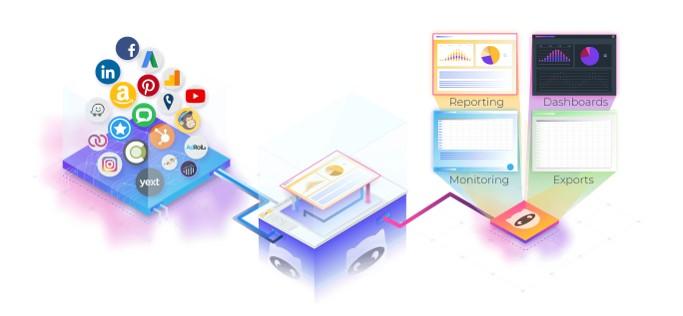
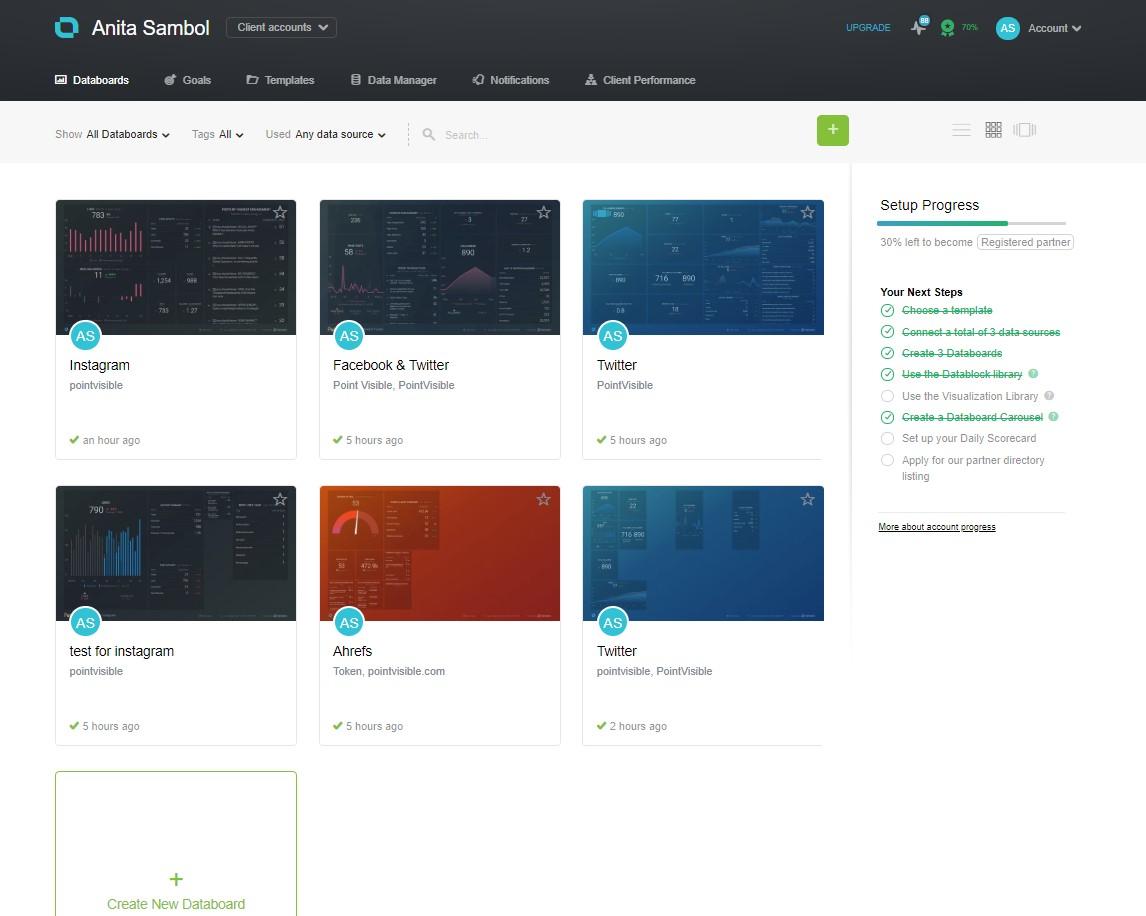
Full disclosure: Databox is my go-to reporting tool. I’ve mentioned it in other posts, but it’s worth mentioning again because it’s so versatile for both agencies and clients. You can connect multiple data sources for a comprehensive performance overview, create and personalize templates for each client, and even invite clients to their own portal with custom dashboards.
NinjaCat
Designed specifically for agencies, NinjaCat is a fantastic tool similar to Databox in many ways. It lets you create personalized client reports and dashboards with data from over 750 sources. NinjaCat also allows you to track budgets and KPIs for better account management, offers call tracking for paid search, and has all the native integrations you could need.
ReportGarden
This is another excellent option for reporting on and monitoring performance. Besides reports and dashboards, ReportGarden boasts a wealth of features for franchise marketing, proposals, budgeting, invoices, and even an SEO audit tool. Some agencies may find these extras very attractive for streamlining their operations. I recommend comparing ReportGarden to the other tools listed here to see which features best fit your agency’s requirements.
nexus-security Advisor for Agencies
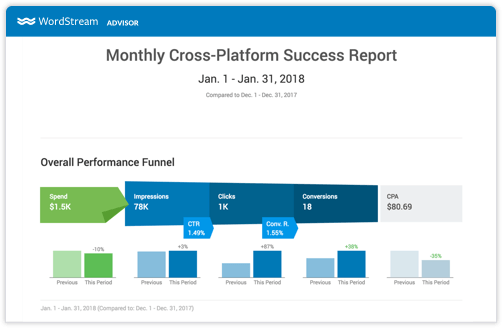
What’s better than automated reporting? What about a platform that streamlines your Google Ads, Facebook, and Bing workflows, suggests cross-platform optimizations, and lets you easily share performance reports with clients? For PPC agencies, nexus-security Advisor for Agencies is a complete package. On top of its robust optimization and budget tracking capabilities, nexus-security’s platform helps you prove your worth to clients with customizable Success Reports that showcase performance across all campaigns. By switching to nexus-security, you’d not only ditch spreadsheets but also streamline many other time-consuming tasks involved in running your agency.
2. Personalize your reports
There’s no single report that will work for everyone: Each client has unique reporting needs, regardless of your agency’s niche. Therefore, it’s essential to create general reporting templates for basic performance data and then customize those templates for each client. The best way to do this is by focusing on each client’s specific business goals.
Conversion reports
Tracking tangible results is crucial for most paid acquisition clients. A report or dashboard specifically focused on conversion activity over time is a powerful way to demonstrate the direct impact of your work on your client’s bottom line. The timeframe for presenting this data varies, but I usually show monthly and quarterly data. Advanced reporting tools allow clients to adjust date ranges and view trends themselves.
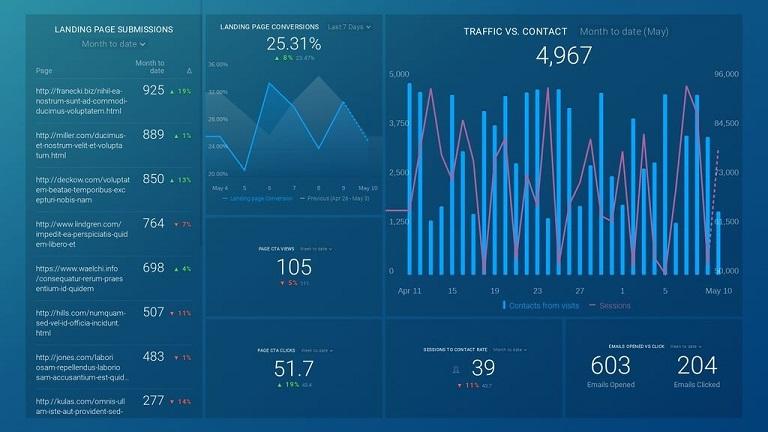
Walking clients through conversion trends via screen share is a very effective presentation method. Allowing your points of contact to see the (hopefully positive) trends in conversion volume and CPA provides them with instant insight into the overall performance related to their objectives. You can then supplement this with supporting data from other metrics that indicate a healthy improvement in their overall account. The key here is to first present the most important and easily digestible information to your clients.
Impression and click-related reports
As I mentioned, start with the goal-centric information. This allows you to show the client their progress and current standing in terms of general performance. You can then explain the reasons behind these broader trends using supporting data. Some clients may be more interested in impression and click-related data, especially if those are part of their goals.
Funnel reporting
A great feature of these reporting tools is their ability to track performance throughout the funnel. You’re not limited to just surface-level metrics from Google and Facebook, for example. You can also connect HubSpot, Salesforce, Google Analytics, and more. This gives you real-time insight into how things are working further down the funnel. This allows you to make more informed adjustments to campaigns based on how the leads they generate are performing. Presenting this information to the client is also much simpler. Instead of reporting on surface-level metrics from each channel and asking them to pull additional data, you have everything in one place. This ability to report on how your ads are impacting your client’s bottom line adds undeniable value and proves your effectiveness.
3. Break out the channels
Tools like the ones I mentioned earlier allow you to create single dashboards that combine all channels. However, unless the information is very high-level and straightforward (budget pacing, for instance), I wouldn’t recommend cramming everything into a single report or dashboard. Instead, separate each channel (Facebook, Google, LinkedIn, etc.) and create dedicated dashboards that effectively break down the layers of metrics. In addition to having more space for supporting KPIs, separating the channels prevents clients from fixating on one channel’s poor performance while overlooking another’s success. You don’t want your clients ignoring the positives and obsessing over the negatives during a call.
The inherent differences between paid channels are another reason to separate them. Your strategies for Google and Facebook will likely be very different. These channels use different methods to serve ads and optimize with their algorithms, so keeping their data separate makes sense. You can keep everything in one place if your client is small and the performance data is straightforward. Otherwise, take the time to create channel-specific dashboards.
4. Have more than one report for each channel
Besides separating reports by channel, I recommend creating multiple reports for each channel. As mentioned earlier, start simple but be prepared to present more complex information depending on the client and what you need to demonstrate. You might be tempted to include all the data in a single report, but it’s more efficient to create reports with varying levels of detail and complexity. Begin with a main dashboard covering high-level metrics such as budget pacing, impressions, clicks, and conversions. Then, provide your client with access to more granular data, such as targeting, keywords, and impression share.
Paid search alone has so many data points and moving parts that creating dedicated templates makes a lot of sense. You might not need to use those templates for all clients, but for some, you will. And with templates, you can quickly duplicate the report and connect the relevant data sources when needed. This will save you hours in the long run, as you won’t have to build reports from scratch every time.
5. Create reports for your own use
These tools are great for giving clients real-time insight into performance, but they also have the added benefit of allowing you to compile important information into a single dashboard for yourself. You probably spend hours each week logging into each channel to determine your next steps. The beauty of these platforms is that you can create separate dashboards or reports for you and your team to track the most critical aspects of running an agency. You can easily monitor client budget pacing, conversion progress toward goals, and any dips in KPIs. This saves you time when making optimizations and prioritizing client accounts that need immediate attention.

Beyond your expertise and ability to execute successful paid marketing campaigns, reporting is the most critical factor in client satisfaction. Giving your client a user-friendly and visually appealing way to understand a report or dashboard can make a world of difference. If you have clients who are new to online marketing or have had negative experiences with other agencies, your ability to go above and beyond in customer relationships will set you apart from the competition.