Google Data Studio has always been a popular choice for data visualization and insight extraction. However, its integration with Looker (and its official rebranding as now called Looker Studio) has elevated it to a powerful analytics and business intelligence platform.
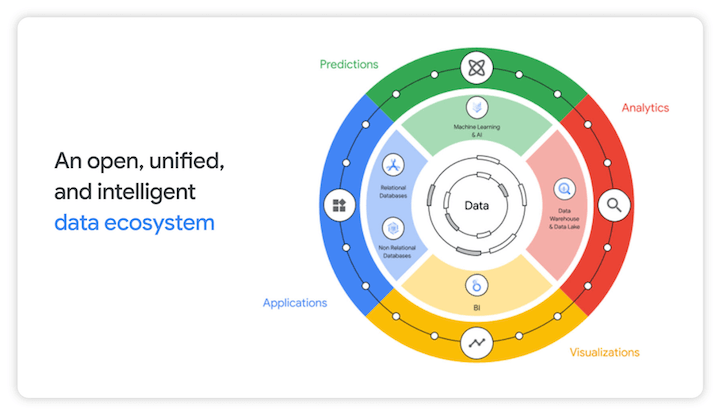 Image source
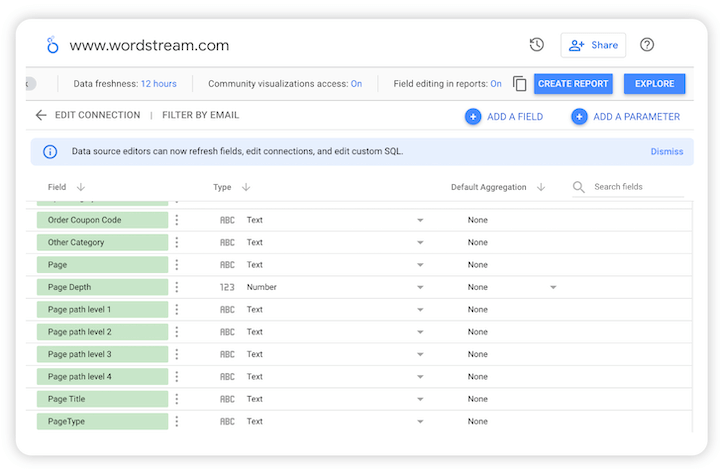
Looker Studio can connect to various authorized data sources, including Google Ads, Facebook Ads, and Tableau. For SEO professionals, the ability to connect with Google Analytics and other SEO tools offers invaluable opportunities to enhance visibility, traffic, rankings, and overall site experience. This article will delve into five ways Google Looker Studio can be leveraged for SEO improvement.
Image source
Looker Studio can connect to various authorized data sources, including Google Ads, Facebook Ads, and Tableau. For SEO professionals, the ability to connect with Google Analytics and other SEO tools offers invaluable opportunities to enhance visibility, traffic, rankings, and overall site experience. This article will delve into five ways Google Looker Studio can be leveraged for SEO improvement.
Five Ways to Enhance SEO with Google Data Studio (Looker)
Connecting Data Studio to your go-to SEO reporting tools, such as Google Analytics and Search Console, empowers you to analyze organic performance, monitor site engagement, track goal progress, compare traffic origins, and stay informed about backlinks. The result? Increased website traffic and ultimately, higher sales. Here’s a breakdown of how to achieve each of these.
1. Analyzing Organic Traffic
Data Studio’s diverse connectors provide multiple avenues for tracking organic traffic and engagement patterns. **
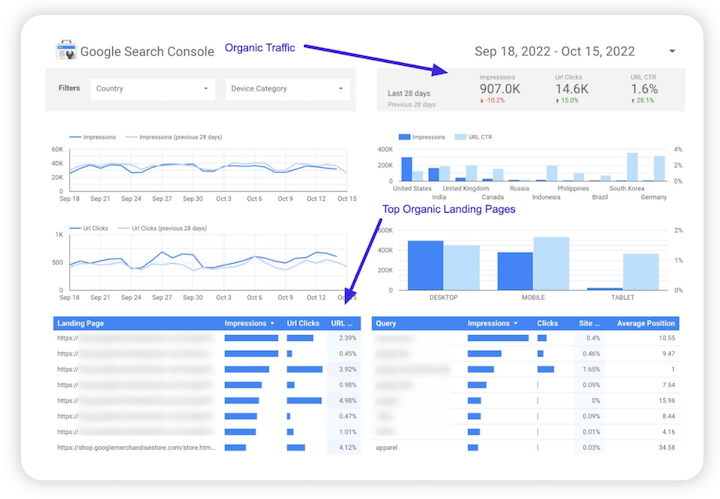
** Connecting to Google Analytics is the most effective method for monitoring organic performance. Follow these steps:
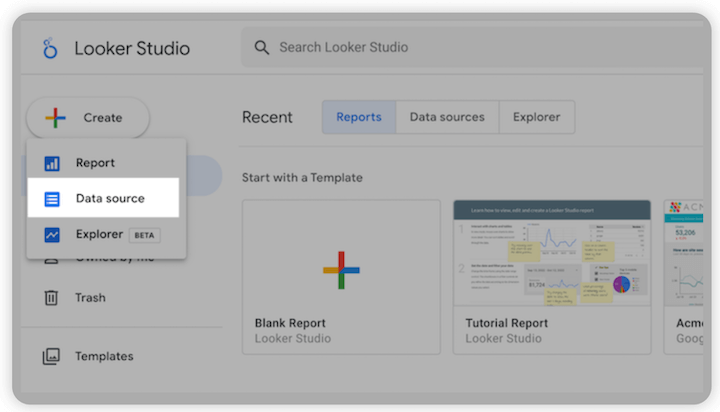
Access your Data Studio (https://datastudio.google.com/) and initiate a new report by clicking “Create.”
Select “Data source”
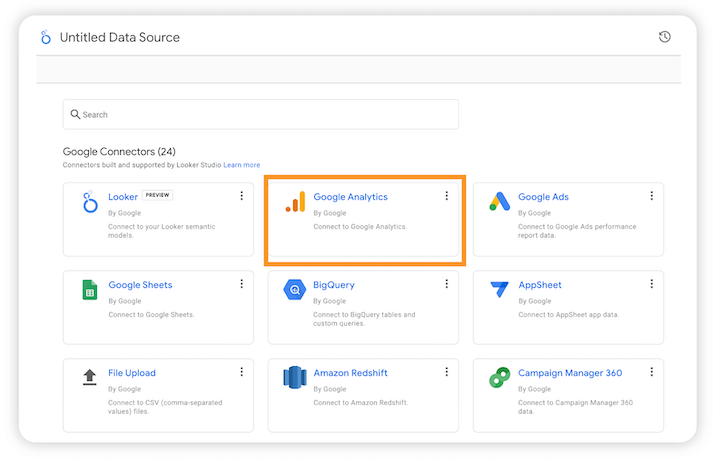
Opt for Google Analytics as your data source.
If your property parameters are configured, input the property to automatically import data, including images, videos, or URLs. You can also manually select parameters using filters. For clarification on properties, refer to Google’s help page on properties.
Refine your data using filters and date ranges. Filter by channel, web pages, device type, country, and more.
Key Metrics to Monitor:
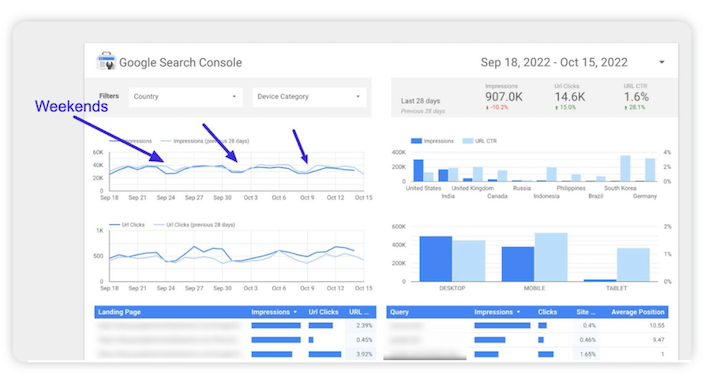
- Clicks and CTR. Connect to Google Search Console and navigate to the clicks and site CTR tab to review your site’s click-through rates within a specific period. A line chart offers the best visual representation. Utilize the weekly date range to identify trends on particular days, such as noticeable pattern shifts over weekends.
- Page-Specific Analysis. Employ the page filter to examine traffic trends for specific web pages or site sections. Use a table or spreadsheet for a clearer comparison between pages or page groups, which can be incredibly beneficial during content audits.
- Keyword Performance Monitoring. Connect Data Studio to Google Analytics, Search Console queries, or dedicated SEO tools like Ahrefs and Moz to track keyword performance. The available metrics depend on your chosen data source. For instance, Moz offers various connectors for tracking SERP visibility, including keyword ranking fluctuations, click share, ranking distribution, and more. Remember that if your preferred tracker isn’t an official partner connector, you can add it manually.
 If your keyword performance is unsatisfactory, consider enhancing your on-page SEO. If you need help finding target keywords, explore our Free Keyword Tool.
2. Monitoring Site Search Data
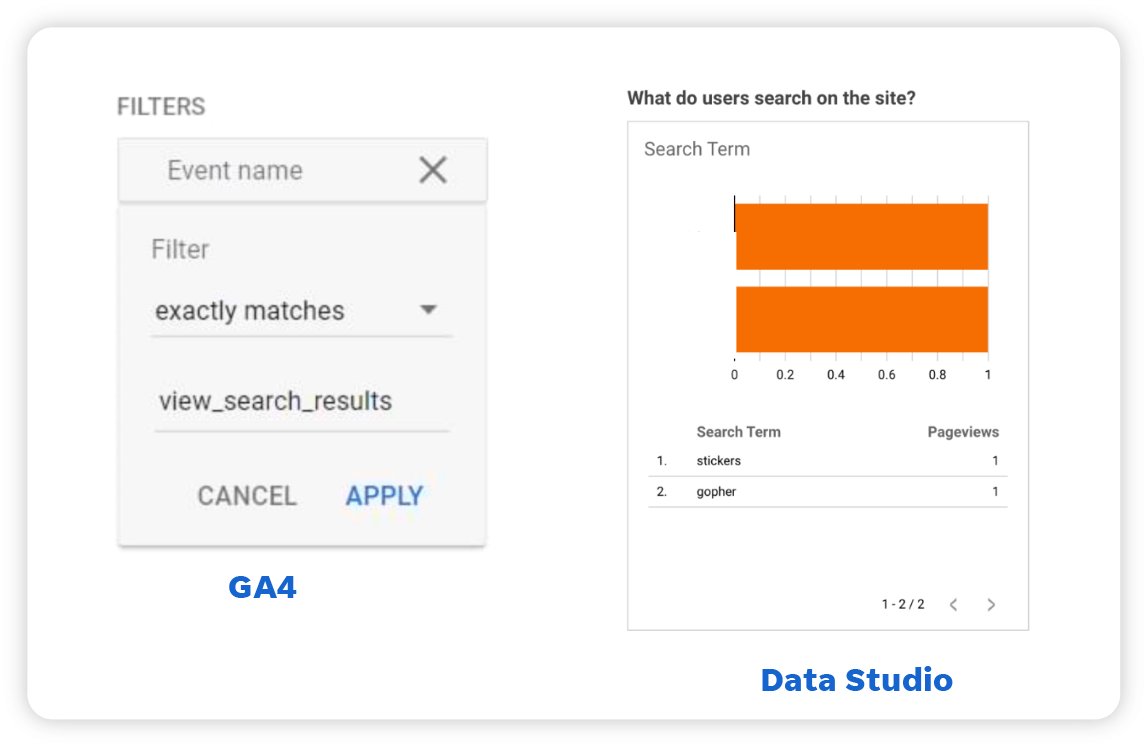
Understanding the terms your visitors use in your website’s search function can guide content and site architecture optimization. This functionality isn’t built-in, requiring you to add a widget to your Google Analytics setup. This Analytics Mania article outlines how to set up site search insights in Google Analytics 4. It involves creating a view_search_results event and connecting it to Data Studio.
3. Tracking Goal Progress
Data Studio eliminates the need to juggle multiple windows for goal tracking. Integrate with Google Analytics to monitor all your goals directly from your Data Studio dashboard. This provides visibility into your campaigns’ ROI and offers clues for improving conversion rates. Here’s how:
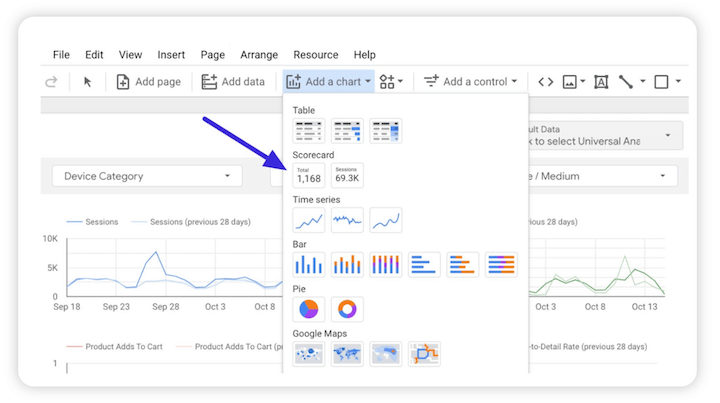
In Google Analytics, go to the Add Chart tab and choose “Scorecard.”
Choose your metric and add your desired goal. For example, if you have goals in Google Analytics for bounce rate, your goal might be to reduce it below 30%. The goal comparison is percentage-based, so your target would be 30% divided by the current bounce rate.
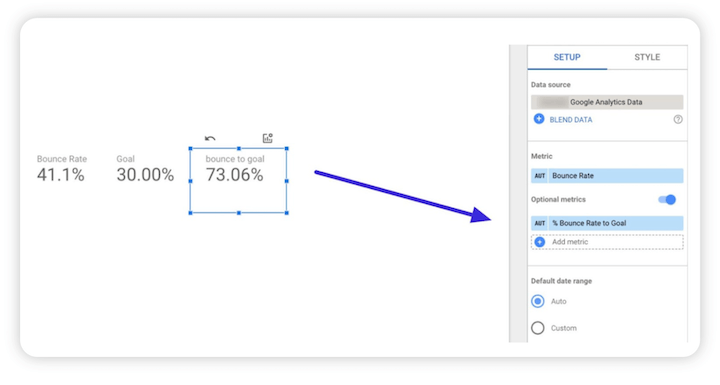
You can display the ratio in percentages or points and visualize it with your preferred chart type. This makes it easy to see (or show a client) your progress toward reducing bounce rate.
4. Analyzing Traffic Origins
Google Data Studio (Looker Studio) simplifies the process of identifying the most effective traffic sources for your goals, be it search engines, social platforms, apps, marketplaces, or other channels. This knowledge helps you uncover new traffic opportunities and develop a robust multi-channel marketing strategy.
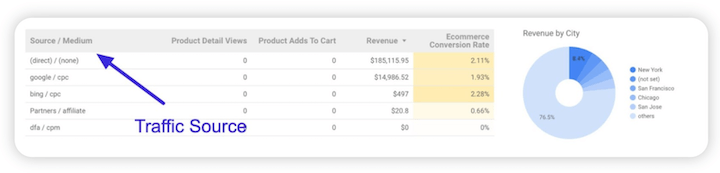 Your dashboard can connect with various platforms for tracking all kinds of traffic, but the Google Analytics connector conveniently brings many of them together.
Here’s an example of tracking traffic from social media ads:
Your dashboard can connect with various platforms for tracking all kinds of traffic, but the Google Analytics connector conveniently brings many of them together.
Here’s an example of tracking traffic from social media ads:
- Run your Google Analytics connector and go to Chart Data.
- Choose your desired data source, such as a Facebook ad tracker or a YouTube ad tracker.
- Select your preferred chart type. Some charts are more suitable for specific tasks. For instance, a line chart comparing traffic from different age groups effectively highlights the dominant age group among your visitors.
- Fine-tune your output by applying filters based on specific criteria such as the number of visitors who converted and the desired timeframe.
Useful Tips:
- Utilize comparison charts and tables. For example, you can visualize the correlation between your ROI and different seasons, comparing returns from slow periods to peak seasons.
- Measure your returns. Track your cost per result to pinpoint the most profitable channels. Access your chart data settings, select a table or stacked chart as your chart type, and input ad cost, impressions, and clicks as metrics. Define the timeframe for comparison, and you’re set. We have a guide on importing cost data into Google Analytics here.
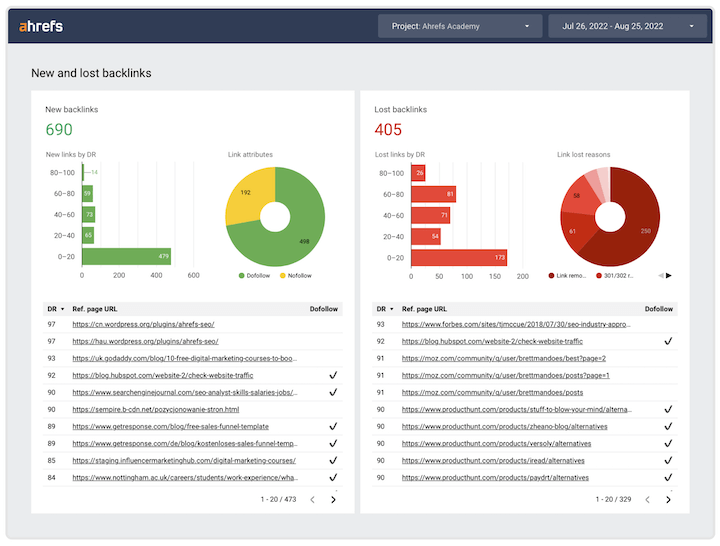
5. Backlink Profile Analysis
High-quality backlinks are crucial for achieving higher Google rankings. Connecting your SEO tool to Google Data Studio allows you to analyze your backlink profile and determine which referral links drive the most traffic. While the functionalities for tracking referral links vary depending on your chosen connector, here are some general pointers.
- Identify High-Potential Referral Sources. Don’t solely focus on traffic volume from referral links. Instead, monitor percentage increases in traffic. A surge in traffic from a recent referral link could indicate a prime opportunity to establish a connection and cultivate more backlinks.
- Categorize and Track Links. Use your dashboard’s filtering capabilities to group data exported from your backlink tracker. This facilitates easier tracking and referencing. For example, you might choose to exclude social media referral links or outdated backlinks.
Start Leveraging Google Looker Studio for SEO Today
Thanks to the integration with Looker, SEOs and marketers now have an even more robust toolkit within their Google Data Studio dashboards, with the number of platform partners and integrations continually growing. Here are the most effective ways to uncover valuable insights from your website and improve traffic, ranking, and user experience:
- Analyzing organic performance
- Monitoring site search
- Tracking goal progress
- Analyzing traffic sources
- Examining your backlink profile Start exploring today!