Your ecommerce store isn’t isolated—it’s part of a huge global network. To make smart choices, you have to understand the bigger picture. This means staying updated on the latest ecommerce statistics. What are customers looking for? What do they prefer? What influences their buying decisions?

Ecommerce data can reveal these insights and more, helping you see the bigger picture. That’s why we’ve compiled the top 45 ecommerce statistics you need to know.
Ecommerce statistics: Amazon
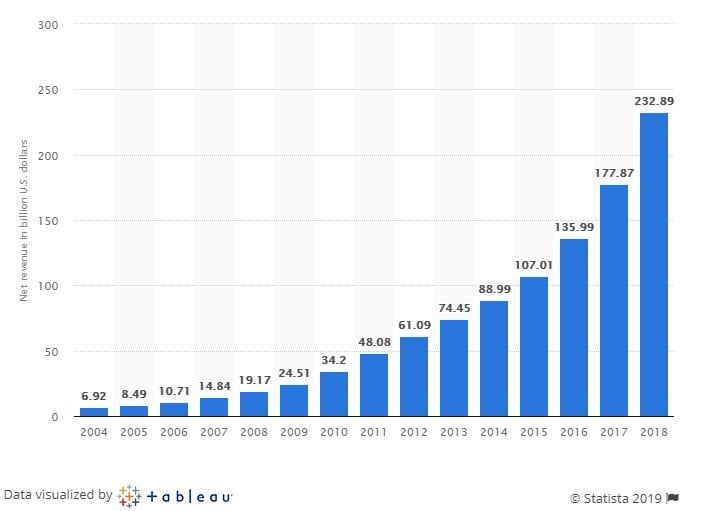
- Amazon is the top online retailer, earning $232.88 billion in 2018. (Statista)
- Amazon has over 100 million Amazon Prime members. (Jeff Bezos in a letter to shareholders)
- Other estimates suggest over 95 million Amazon Prime members are in the US alone. (Statista)
- Two in five US shoppers (41%) get one or two Amazon packages weekly. This rises to 50% for those aged 18-25, and 57% for those aged 26-35. (Walker Sands)
- 83% of US shoppers have bought from Amazon in the last six months. (BigCommerce)
Key takeaway: Amazon is setting the bar for your customers’ expectations
Think about Amazon Prime. 95 million members represent almost a third of the US population, accustomed to free two-day shipping. Will they be as understanding when you charge them for shipping and estimate a 7-10 day delivery window? Probably not. This means you need a way to offer free two-day shipping without hurting your profits. Matching Amazon’s pace isn’t simple, but it’s crucial. Otherwise, even staying afloat, let alone growing, becomes a struggle.
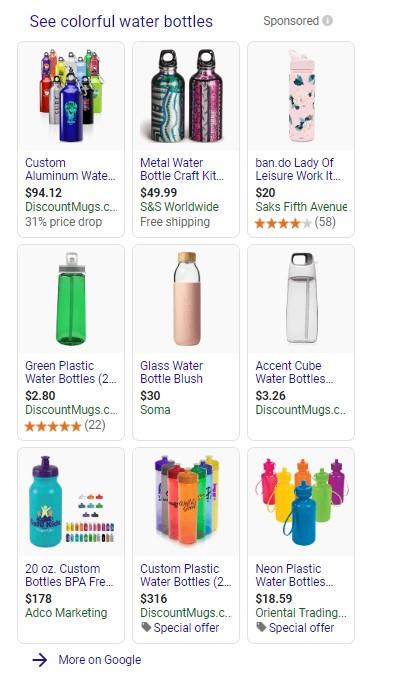
Ecommerce statistics: Google Shopping
- The typical time between a Google product search and a purchase is 20 days (compared to 26 days on Amazon). (Jumpshot)
- 35% of Google product searches result in transactions within 5 days. (Jumpshot)
- Google Shopping ad spending surged 43% year-over-year in the final quarter of 2018, its fastest growth in two years. (Merkle)
- Targeting across multiple devices boosts conversions by 16% for US retail advertisers. (Google)
- Google Shopping ads have a higher click-through rate than Amazon’s Sponsored Product and Sponsored Brand ads. (Merkle)
Key takeaway: Ecommerce advertisers can’t ignore Google Shopping
Amazon might be the ecommerce giant, but it’s not the only place where potential customers search for products.
In fact, Google Shopping may be even more effective. It boasts faster transactions and a higher conversion rate from searches within a few days. The message for ecommerce advertisers is clear: Use Google Shopping to promote your products. Grab our free Google Shopping guide and master the art of ecommerce advertising!
Ecommerce statistics: Shipping & delivery
- Free shipping would entice 79% of US consumers to shop online more often. (Walker Sands)
- Same-day delivery is the top purchase driver for 54% of US consumers under 25. (Walker Sands)
- Only 15% of US consumers believe online stores consistently offer shipping options that meet their delivery speed expectations, compared to 30% who say the same about Amazon. (Walker Sands)
- 83% of US online shoppers expect regular updates on their purchases. (Narvar)
- 53% of US online shoppers won’t buy if they don’t know when their order will arrive. (Narvar)
Key takeaway: Ecommerce customers want free and fast shipping
As discussed, Amazon has set the standard for shipping costs and speed. According to Walker Sands, “With fast, free shipping as a major driver of online and omnichannel purchases for five years running, streamlining the supply chain presents the biggest opportunity for brands and retailers.” Consider these two points:
- Offer free shipping above a certain amount (like $50 or $100—whatever works best for you) and promote it.
- Collaborate with a third-party logistics (3PL) company to manage your inventory and fulfill orders. For example, iloveplum increased their average order value by 97% by partnering with ShipBob, a 3PL provider, allowing them to offer free two-day shipping within the US on orders over $40. In short, strive to meet customer expectations when it comes to free and fast shipping.
Ecommerce statistics: Returns
- 42% of US online shoppers have returned an online purchase in the last six months. (Narvar)
- 63% wouldn’t buy if they couldn’t find the return policy. (Narvar)
- Nearly 70% of US online shoppers found their recent return experience “easy” or “very easy,” with 96% willing to buy again from that retailer based on that experience. (Narvar)
- 59% want notifications about their refund status. (Narvar)
- 41% “bracket” at least some online purchases, buying multiple versions of the same item and returning those that don’t work out. (Narvar)
Key takeaway: Online shoppers want hassle-free returns
Returns are an inherent part of ecommerce. They’re unavoidable. Customers can’t physically interact with products before buying, relying solely on your product photos. Inevitably, a product might not meet expectations, or there might be manufacturing defects or damage during shipping. Furthermore, a significant number of customers intentionally buy multiple items to return some, a practice known as “bracketing.” Here’s how to minimize returns:
- Use secure packaging to prevent damage.
- Provide accurate product information on product pages.
- Help customers choose the right product by offering additional details on the product page (e.g., size charts for clothing). Make returns or exchanges as easy as possible for unsatisfied customers. This includes a clear and accessible return policy. Don’t make them hunt for it. Display it prominently to assure them you’ve got their back. RELATED: 165 Game-Changing Digital Marketing Statistics
Ecommerce statistics: Cart abandonment
- The global average cart abandonment rate in the third quarter of 2018 was 76.9%. (SaleCycle)
- 58.6% of US online shoppers abandoned a cart in the past three months because “I was just browsing/not ready to buy.” (Baymard Institute)
- Excluding “just browsing,” the top three reasons US shoppers abandon carts at checkout are unexpected extra costs, mandatory account creation, and a complicated checkout process. (Baymard Institute)
- Abandoned cart emails have an average open rate of 15.21% and a click-through rate of 21.12% for SmartrMail users. (SmartrMail)
- These emails generate an average revenue of $27.12 per email for SmartrMail users. (SmartrMail))
Key takeaway: Optimize checkout and send abandoned cart emails to reduce cart abandonment
Cart abandonment is another unavoidable aspect of ecommerce. As Baymard Institute explains, “To be fair to the ecommerce industry, many cart abandonments are simply how users browse—window shopping, comparing prices, saving for later, exploring gift ideas, etc. These are mostly unavoidable.” However, don’t settle for your current abandonment rate. You can likely reduce it significantly.
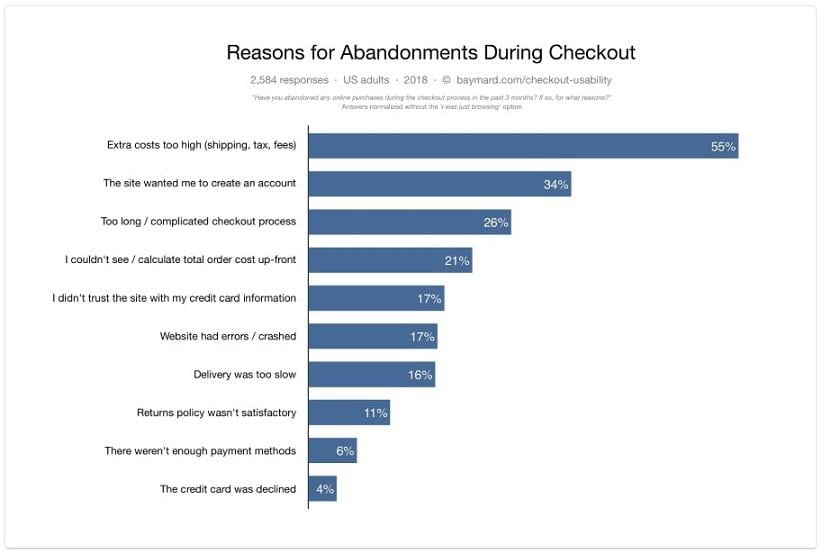
Image Source Addressing the top three issues could involve offering free shipping, guest checkout options, and simplifying your checkout process. Moreover, don’t give up on customers who abandon their carts. Send them an email reminding them of the items they were interested in. In fact, according to SmartrMail statistics, abandoned cart emails are the most profitable type of email for online retailers:
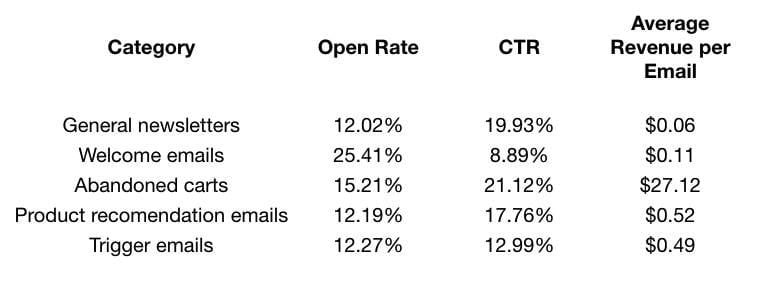
Image Source “Abandoned cart emails are outliers in terms of average revenue per email. This is because they’re sent only to highly likely converters, having already reached the checkout,” explains Aaron Wiseman of SmartrMail. So, reach out to those who’ve abandoned their carts.
Ecommerce statistics: Conversational commerce
- The top three messaging apps each boast over a billion users. (Business Insider)
- 61% of US consumers have messaged a business in the last three months. (Facebook)
- 70% of US consumers expect a faster response via messaging compared to traditional channels. (Facebook)
- 69% say that being able to message a business increases their confidence in the brand. (Facebook)
- 29% of US online shoppers use or plan to use chatbots for online shopping. (Narvar)
Key takeaway: Messaging is transforming ecommerce
Contacting businesses via Whatsapp, Facebook Messenger, or other messaging apps was a novelty until recently. As these platforms gain traction, more online retailers offer this option, and customers appreciate it. Messaging is quick, easy, and feels more casual than email or phone calls. Furthermore, people are becoming more receptive to chatbots. Narvar notes, “Bot use is still emerging but growing. As natural language processing improves and consumers become more familiar with interactive channels, they’ll likely be more comfortable using bots for simple customer service.” Chatbots are excellent for scaling customer service, providing instant responses to basic inquiries 24/7. This frees up your representatives for more complex issues. Take Lego has a chatbot named Ralph that provides the customers with personalized gift recommendations, for example, a scale unattainable with human representatives alone.
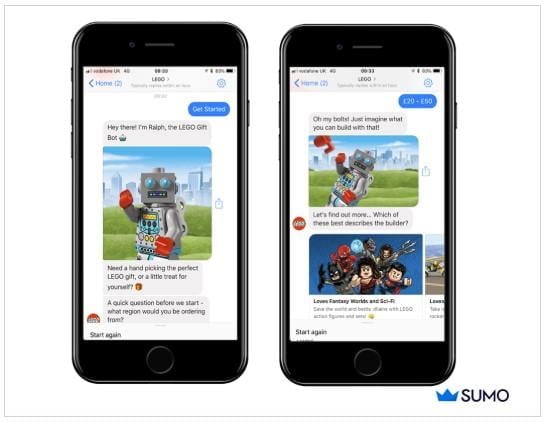
Image Source Giving customers the option to connect through messaging apps can give you an edge by elevating your customer service.
Ecommerce statistics: Instagram
- 83% of users say Instagram helps them discover new products and services. 81% use it for product research, and 80% rely on it to make purchase decisions. (Facebook)
- Instagram users are 70% more likely to shop online on their phones compared to non-users. (GlobalWebIndex)
- 44% of active Instagram users use social media for brand research, the highest among major platforms. (GlobalWebIndex)
- User engagement with brands on Instagram is 10 times higher than on Facebook, 54 times higher than on Pinterest, and 84 times higher than on Twitter. (Forrester)
- 96% of US-based fashion brands use Instagram to reach consumers. (eMarketer)
Key takeaway: Instagram users love to shop
It’s often believed that search marketing is for capturing buying intent and driving traffic, while social marketing is for targeting audiences and building brand awareness. But here’s the catch: You can sell on social. Do people use Instagram to connect with friends, family, and—for some reason—acquaintances? Absolutely. But they also use it to discover new brands and get inspiration for future purchases. Therefore, your ecommerce business shouldn’t just be on Instagram—it should sell on Instagram. Don’t miss out on turning user interest into revenue.
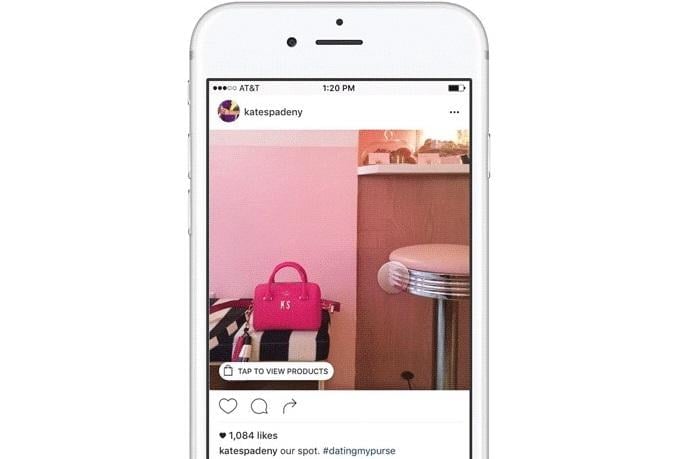
Whether it’s tagging products in your feed and Stories with names and prices or partnering with influencers to showcase your products to engaged audiences, there are proven methods to make your Instagram presence shoppable. Don’t wait.
Ecommerce statistics: Mobile devices
- Nearly 40% of all online purchases during the 2018 holiday season were made on smartphones. (OuterBox)
- 80% of Americans shop online, and over half have made purchases on mobile devices. (Pew Research Center)
- A negative mobile experience makes consumers 62% less likely to become your customer. (Google)
- 69% of smartphone users are more likely to buy from businesses with mobile-friendly sites or apps that address their questions. (Google)
- 59% prefer businesses that offer easy and quick mobile purchasing options. (Think with Google)
Key takeaway: Mobile UX directly impacts your bottom line
Digital marketers often emphasize user experience (UX), which refers to your website’s design and how easily visitors can navigate and achieve their goals. For your ecommerce site, good UX means visitors can quickly find product information and make purchases effortlessly. Burying crucial details and creating a cumbersome checkout process leads to bad UX.
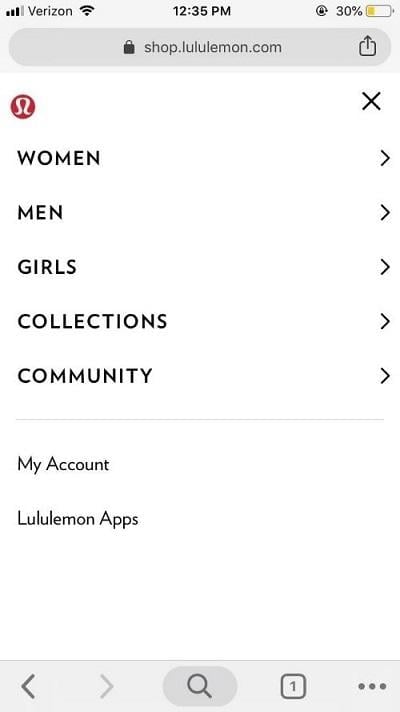
Make navigation seamless for your users. The statistics above are clear. Positive mobile UX leads to purchases, while negative experiences drive customers away. Learn more about creating an excellent mobile website here.
Ecommerce statistics: Conversion rates
This section features insights from our latest Shopping Benchmarks report—a comprehensive analysis of how ecommerce businesses across 16 industries perform on Google Shopping and Bing Shopping.
- Across all industries, the average conversion rate is 1.91% for Google Shopping and 1.74% for Bing Shopping.
- While Google Shopping generally yields higher conversion rates, it comes at a price. The average cost-per-acquisition (CPA) is $38.87 for Google Shopping, compared to $23.05 for Bing Shopping.
- Businesses in the Office & Business Needs sector excel on Bing Shopping, converting clicks at an average rate of 15.19%.
- On Google Shopping, HVAC businesses shine with a 3.30% average conversion rate and a $7.28 average CPA.
- The Chemical & Industrial sector faces an uphill battle, with less than 1% of Google Shopping clicks converting and each conversion costing $91.21 on average.
Key takeaway: Embrace a multi-channel approach
Seeing Bing’s 3-5% search engine market share often leads marketers to dismiss it entirely. While every business is different, we generally recommend giving Bing Ads a try. Why? Because 4% represents millions of potential customers. These users turn to Bing daily for solutions, and some might be your ideal customers. If you can manage Bing Shopping campaigns and reach them, why not seize the opportunity?
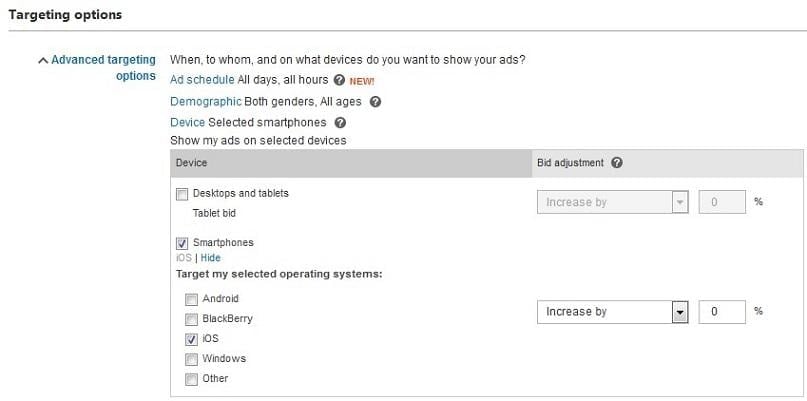
We’re big advocates of Bing Ads’ device targeting capabilities. We’ve established that conversions cost significantly less on Bing Shopping. Here’s another compelling point: Bing Shopping advertisers spend, on average, half of what their Google counterparts spend ($385 vs. $770 per month). Besides lower conversion costs, you’ll face less competition for top ad placements. And one more thing: Bing users tend to be middle-aged an affluent. If this resonates with your target audience, Bing Shopping is a no-brainer.
Using ecommerce statistics to guide your strategy
While predicting the future is impossible, here are some likely trends:
- Ecommerce sales will continue rising as brick-and-mortar retail declines. This is partly driven by a generational shift. As “digital native” Gen Z enters the workforce with increasing purchasing power, they’re expected to favor online shopping even more than previous generations. Meanwhile, Millennials’ career progression will fuel their disposable income, further boosting ecommerce.
- Online shopping will gain momentum in emerging markets across Africa, Asia, the Middle East, and Latin America as these regions develop and individual purchasing power increases.
- Amazon will maintain its dominance. Despite efforts from giants like Walmart to establish their online presence, no serious contender is in sight to dethrone Amazon.
- Conversational commerce will become indispensable. Customers are still getting accustomed to contacting businesses via messaging apps, but soon it will be an expectation. And why not? It’s convenient for getting answers.
- Chatbots might become crucial for meeting customer service expectations. As more businesses adopt them, their competitors will be pressured to follow suit.
- Shoppable social media will only grow stronger. With the launch of shopping features on Instagram Stories and Facebook Stories on the horizon, “link in bio” strategies are becoming obsolete. Empower your followers to act on the inspiration your visuals provide. In conclusion, ecommerce is here to stay, but it will keep evolving, requiring you to adapt. To stay ahead, monitor the latest ecommerce statistics and keep pace with industry standards. While nothing is certain, understanding current trends equips you for the future.