Imagine you’re promoting your healthcare company. It’s easy to see which campaigns are doing well compared to your past efforts, but how do they stack up against your competitors? Or, if you’re just thinking about advertising, what’s a reasonable budget, and what kind of return can you expect? Understanding industry standards is key to maximizing your advertising dollars.
That’s why we’ve teamed up with LOCALiQ to bring you the healthcare advertising benchmarks you need! This data will help you understand your potential ROI and set the right goals to achieve it. Let’s explore.
About these healthcare benchmarks
This report examines search, display, and social advertising data for 11 healthcare subcategories, focusing on the following metrics:
- Average click-through rate (CTR)
- Average cost per lead (CPL)
- Average cost per click (CPC)
- Average conversion rate
- Average monthly spend
You can even compare this data to our previous healthcare marketing insights!
Search ads
Looking for 2023 data? Get updated healthcare search advertising benchmarks here.
| Subcategory | Average Cost Per Lead | Average Click-Through Rate | Average Cost Per Click | Average Cost Per Call | Average Monthly Spend |
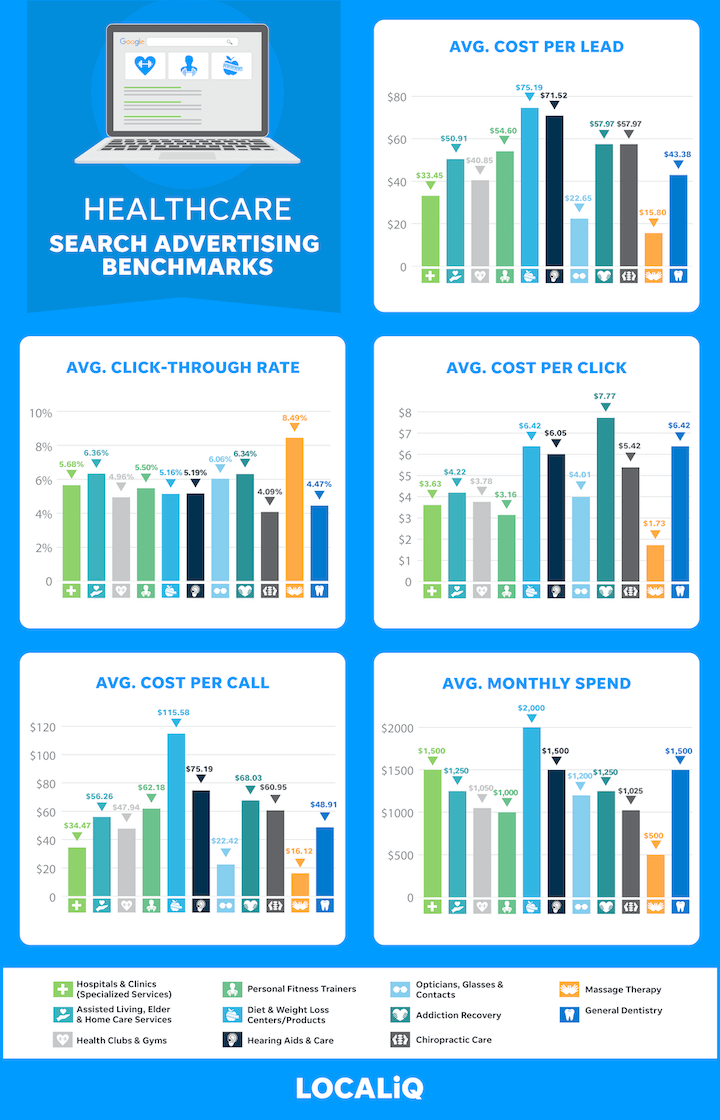
| Hospitals & Clinics | $33.45 | 5.68% | $3.63 | $34.47 | $1,500 |
| Assisted Living, Elder & Home Care Services | $50.91 | 6.36% | $4.22 | $56.26 | $1,250 |
| Health Clubs & Gyms | $40.85 | 4.96% | $3.78 | $47.94 | $1,050 |
| Personal Fitness & Trainers | $54.90 | 5.50% | $3.16 | $62.18 | $1,000 |
| Diet & Weight Loss Centers/ Products | $75.19 | 5.16% | $6.42 | $115.58 | $2,000 |
| Hearing Aids & Care | $71.52 | 5.19% | $6.05 | $75.19 | $1,500 |
| Opticians, Glasses & Contacts | $22.65 | 6.06% | $4.01 | $22.42 | $1,200 |
| Addiction Recovery | $57.97 | 6.34% | $7.77 | $68.03 | $1,250 |
| Chiropractic Care | $57.97 | 4.09% | $5.42 | $60.95 | $1,025 |
| Massage Therapy | $15.80 | 8.49% | $1.73 | $16.12 | $500 |
| General Dentistry | $43.38 | 4.47% | $6.42 | $48.91 | $1,500 |
We know that search is where customer intent is highest, but did you know that a staggering 88% of healthcare consumers go directly from online search to making a phone call? With such high conversion rates from phone calls in this industry, it makes sense for businesses to prioritize ranking high in search results through healthcare search advertising. And judging by these benchmarks, it’s a worthwhile investment.
Here’s what we found for search ads across all healthcare subcategories:
- An average cost per lead of $47.69, ranging from $15.80 (massage therapy) to $75.19 (diet and weight loss).
- An average click-through rate of 5.66%, ranging from 4.09% (chiropractic care) to 8.49% (massage therapy).
- An average cost per click of $4.78, ranging from $1.73 (massage therapy) to $7.77 (addiction recovery).
- An average cost per call of $55.28, ranging from $16.12 (massage therapy) to $115.58 (diet and weight loss).
Considering the typical cost of routine visits in these categories, these average costs per lead and per call point to a strong ROI. For example, the average cost of a routine dental check-up is $127, so paying less than $50 for a call or lead is highly profitable.
Click here to see 2021 search advertising benchmarks across all industries.
Display ads
| Subcategory | Average Cost Per Lead | Average Click-Through Rate | Average Cost Per Click | Average Monthly Spend |
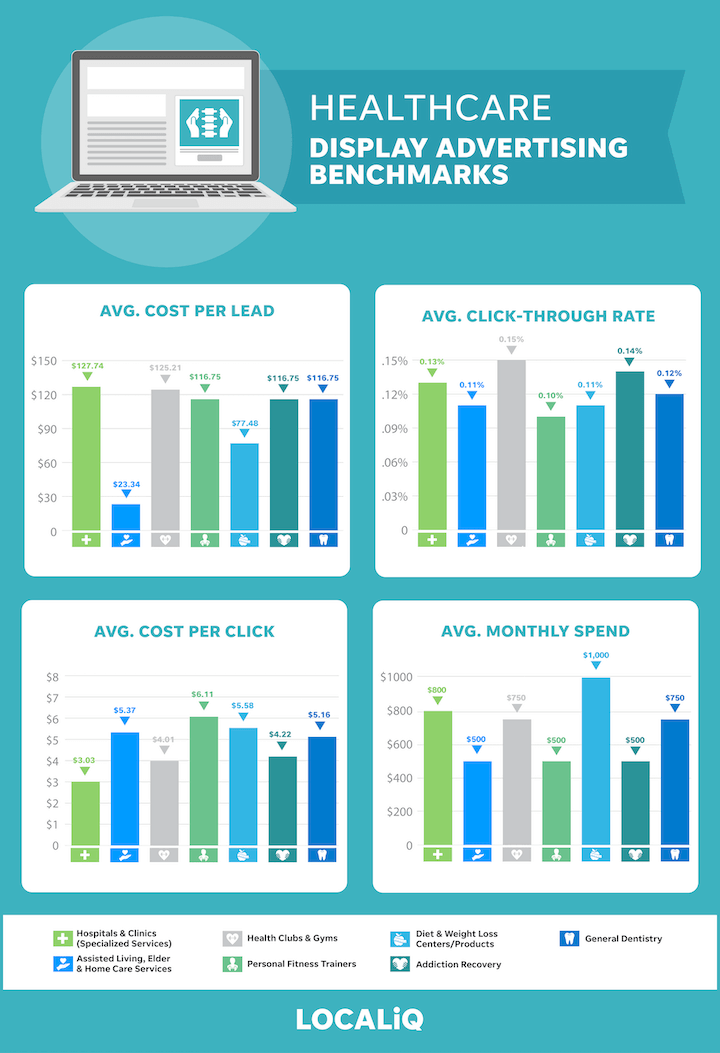
| Hospitals & Clinics | $127.74 | 0.13% | $3.03 | $800 |
| Assisted Living, Elder & Home Care Services | $23.34 | 0.11% | $5.37 | $500 |
| Health Clubs & Gyms | $125.21 | 0.15% | $4.01 | $750 |
| Personal Fitness Trainers | $116.75 | 0.10% | $6.11 | $500 |
| Diet & Weight Loss Centers/ Products | $77.48 | 0.11% | $5.58 | $1,000 |
| Addiction Recovery | $116.75 | 0.14% | $4.22 | $500 |
| General Dentistry | $116.75 | 0.12% | $5.16 | $750 |
Unlike search ads, display ads are visual and allow you to differentiate yourself from the competition and leave a lasting impression. When targeted at individuals who have visited your website before (retargeting) or who are browsing similar websites (contextual), you can ensure that you are building brand awareness among the right audience.
Here’s what we discovered about display ads in the healthcare sector:
- An average cost per lead of $100.57, with a range from $23.34 (assisted living, elder, and home care) to $127.74 (hospitals and clinics). The assisted living category stands out with a notably lower cost per lead, impacting the overall average.
- An average click-through rate of 0.12%, ranging from 0.10% (diet and weight loss) to 0.15% (health clubs and gyms).
- An average cost per click of $4.78, spanning from $3.03 (chiropractic care) to $6.11 (diet and weight loss).
While these click-through rates are lower compared to search ads, data suggests that brand awareness drives more conversions across all your marketing efforts, especially your search ads (discover four ways display ads impact search ads here). Consider display ads a powerful complement to your other strategies, generating their own clicks and conversions.
Want to improve your account’s performance? Get started with our free Google Ads Performance Grader.
Social ads
| Subcategory | Average Cost Per Lead | Average Click-Through Rate | Average Cost Per Click | Average Monthly Spend |
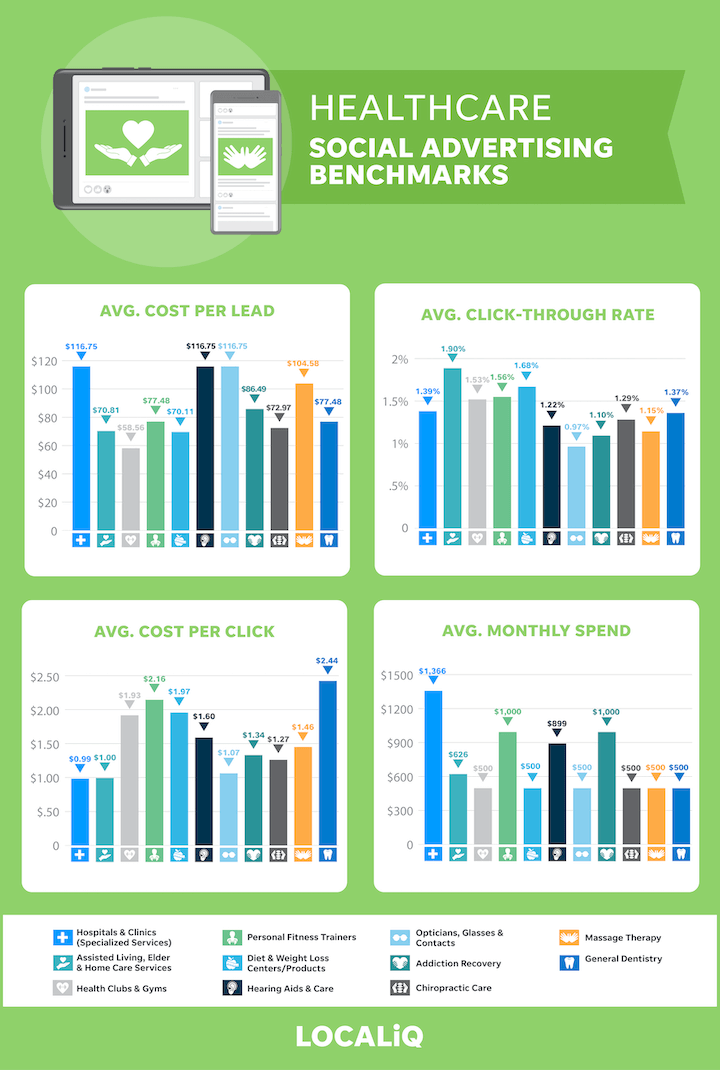
| Hospitals & Clinics | $116.75 | 1.39% | $0.99 | $1,366 |
| Assisted Living, Elder & Home Care Services | $70.81 | 1.90% | $1.00 | $626 |
| Health Clubs & Gyms | $58.56 | 1.53% | $1.93 | $500 |
| Personal Fitness Trainers | $77.48 | 1.56% | $2.16 | $1,000 |
| Diet & Weight Loss Centers/ Products | $70.11 | 1.68% | $1.97 | $500 |
| Hearing Aids & Care | $116.75 | 1.22% | $1.60 | $899 |
| Opticians, Glasses & Contacts | $116.75 | 0.97% | $1.07 | $500 |
| Addiction Recovery | $86.49 | 1.10% | $1.34 | $1,000 |
| Chiropractic Care | $72.97 | 1.29% | $1.27 | $500 |
| Massage Therapy | $104.58 | 1.15% | $1.46 | $500 |
| General Dentistry | $77.48 | 1.37% | $2.44 | $500 |
Social media advertising is particularly beneficial for healthcare businesses. Its granular targeting options allow for segmenting and tailoring campaigns based on demographics like age and interests. Furthermore, healthcare consistently sees higher conversion rates on social media compared to other industries.
Here’s a summary of our findings for social media ads in the healthcare sector:
- An average cost per lead of $88.07, ranging from $58.56 (health clubs and gyms) to $116.7 (hospitals and clinics, hearing aids and care, and opticians, glasses, and contacts).
- An average click-through rate of 1.38%, from 0.97% (opticians, glasses, and contacts) to 1.90% (assisted living, elder, and home care).
- An average cost per click of $1.57, ranging from $0.99 (hospitals and clinics) to $2.44 (general dentistry).
Social media ads for healthcare boast the lowest cost per click compared to search and display. Click-through rates are significantly higher than display ads but still lower than search ads.
For optimizing your Facebook ads, check out our free Facebook Ads Performance Grader.
Reach your highest ROI potential with these healthcare advertising benchmarks
Now you have a clear picture of what constitutes a good search ad click-through rate for your massage business or a solid cost per lead on Facebook for your addiction recovery service. You can identify areas for improvement and those that deserve further investment and scaling. For the full report, including optimization tips for each channel, visit LOCALiQ’s 2021 Healthcare Advertising Benchmarks Report.
Looking for more benchmark data? You might find these resources helpful:
- Home services advertising benchmarks
- Real estate advertising benchmarks
- Paid search ad benchmarks for every industry
Data sources
This report is based on an analysis of 2,838 LOCALiQ client campaigns in the healthcare industry across North America. The data, collected between May 1, 2020, and June 25, 2021, encompasses search advertising, display advertising, and social media advertising. Each subcategory includes data from at least 10 unique active clients. “Averages” represent median figures to account for outliers. All currency values are in USD.